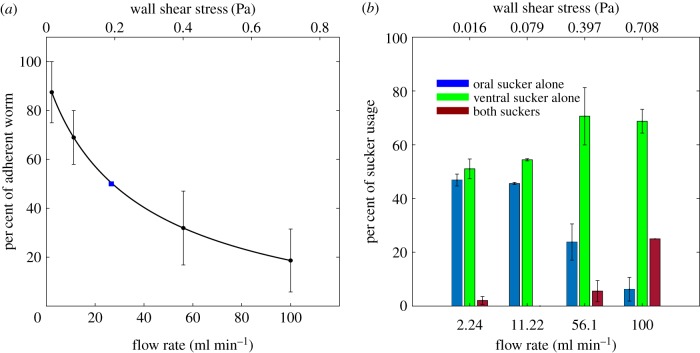
Figure 3.
Substrate adherence of S. mansoni under flow. (a) Percentage of adherent S. mansoni as a function of flow rate and corresponding wall shear stress (average ± standard error, n = 4 worm batches with 11, 20, 5 and 5 worms). A dose–response curve based on fitting to the Hill equation is plotted in black. The blue square indicates the 50% detachment flow rate based on the model. (b) Distribution of sucker usage as a function of flow rate and corresponding wall shear stress (blue, oral sucker alone; green, ventral sucker alone; red, both suckers; data are average ± standard error, n = 41 worms). (Online version in colour.)

