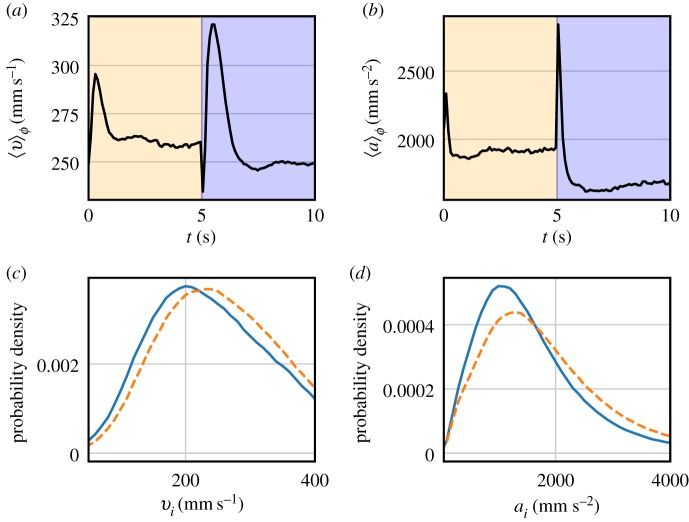
Figure 2.
(a) Phase-averaged velocity magnitude of midges under dynamic lighting conditions. The first 5 s of each period had a 2.3lx level of background light and the last 5 s had 1.3lx of background light. There is a strong ‘startle’ response immediately after the light switches in either direction with greatly increased velocities. After the startle response, midges in the swarm settle into two distinct levels of velocities, with bright phases corresponding to higher velocities. (b) Phase-averaged acceleration magnitude for the same experiment. The startle response is much narrower than for the velocities and the accelerations show a similar split into two distinct levels, with brighter phases resulting in higher accelerations. (c) PDFs of midge velocity magnitudes during the dark phase (solid line) and bright phase (dashed line). During bright phases, the PDF moves towards higher velocities. (d) PDFs of midge acceleration magnitude for the same experiment. Bright phases shift the PDFs to higher accelerations. (Online version in colour.)

