Fig. 2.
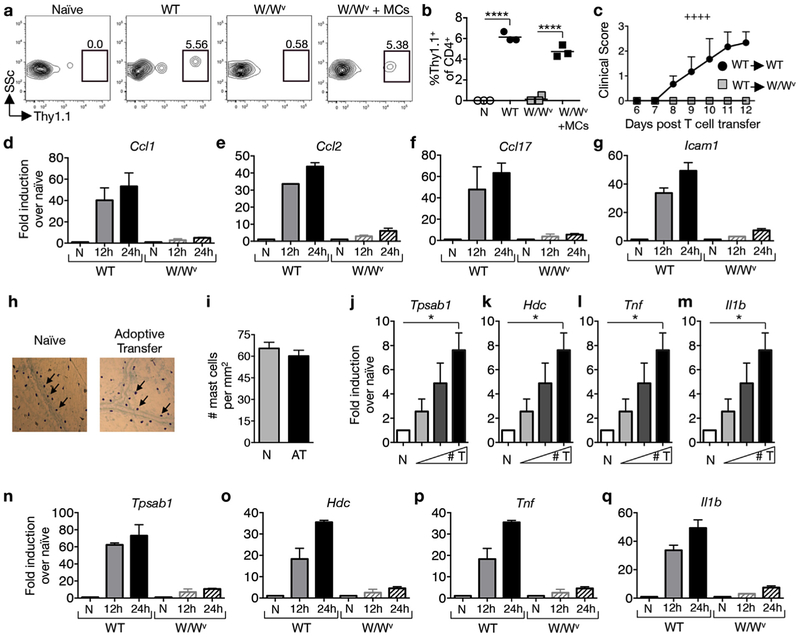
Mast cells are activated by T cell transfer and regulate the accumulation of myelin-specific Th cells in the meninges. MOG35–55-primed T cells from Thy1.1+ mice were reactivated with MOG35–55 peptide in vitro for 4 days before transfer of 4 × 10⁶ blasts to Thy1.2+ wild type (WT), mast cell-deficient KitW/Wv (W/Wv), or meningeal mast cell reconstituted KitW/Wv (W/Wv + MCs) recipients. (a) Representative flow cytometric analysis of Thy1.1+ CD4+ T cell infiltration in the meninges 24 h post transfer. Numbers represent percentage of CD45+CD4+ cells that are Thy1.1+.(b) Frequencies of Thy1.1+ T cells detected in the meninges of indicated recipients. Each data point represents the analysis of pooled meningeal tissue from 4 mice. ****p < 0.0001 by Student’s t-Test. (c) Clinical scores of WT and KitW/Wv recipients after adoptive transfer of 4 × 10⁶ WT T cell blasts. ++++p < 0.0001 by two way ANOVA. 2 independent experiments using 4 mice each. (d–g) RT-PCR analyses of pooled meninges tissues from WT and W/Wv recipient mice at indicated time points. The expression of indicated genes was determined relative to Hprt and expressed as fold induction over naïve. n = 2 pooled samples of 5 mice each for each time point. 2 independent experiments. (h) Meningeal mast cells identified by toluidine blue staining and (i) mast cell numbers in naïve (N) and T cell recipient mice (AT) at 24 h post transfer, n = 9 mice. (j–m) RT-PCR analysis of pooled meninges samples as described in (d–g) 24 h after transfer of T cell blasts [0 (N), 2, 4, and 8 × 10⁶] to wild type recipients. *p < 0.05 by Student’s t-Test. n = 4 per group, 2 independent experiments. (n–q) RT-PCR analyses of pooled meninges as described in (d–g). n = 2 pooled samples of 5 mice for each time point. 2 independent experiments. All values are expressed as mean ± SEM.

