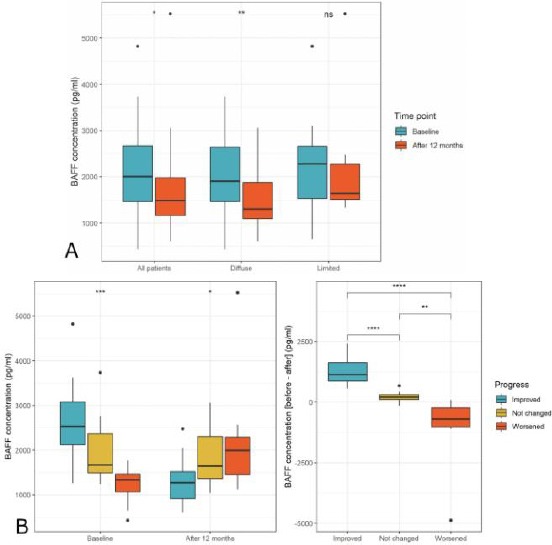
Figure 1.

BAFF level before and after treatment; a) BAFF level before and after treatment in all patients and stratified by types of SSc; b) BAFF level before and after treatment among patients with clinically improved, not changed, and worsened outcome. Comparisons between before and after treatment were made by the paired t-test (for all patients and diffuse SSc patients) and the Wilcoxon signed rank test (for limited SSc patients). Comparisons among outcome groups were made by the Kruskal-Wallis test. NS: not significant; *: p < 0.05; **: p < 0.01; ***: p < 0.001; ****: p < 0.0001
