Figure 1.
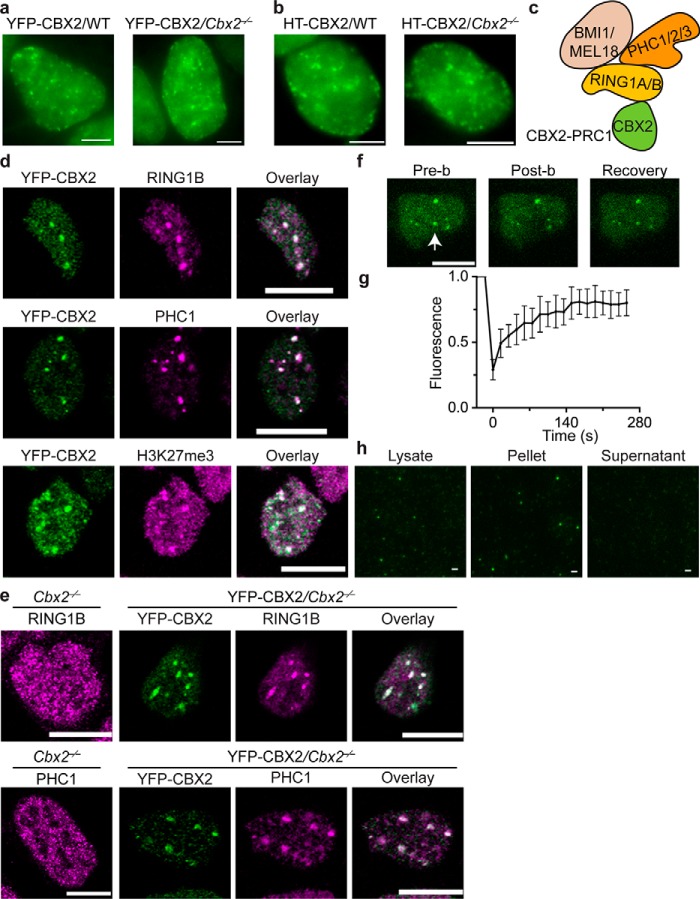
CBX2 phase separates to form condensates in cells. a, live-cell epifluorescence images of YFP-CBX2 in WT and Cbx2−/− mES cells. Scale bars, 5.0 μm. b, live-cell epifluorescence images of HT-CBX2 in WT and Cbx2−/− mES cells. HT-CBX2 was labeled with HaloTag TMR ligand. Scale bars, 5.0 μm. c, schematic representation of the core subunits of the CBX2–PRC1 complex. d, confocal fluorescence images of immunostained YFP-CBX2 and H3K27me3 in WT mES cells as well as endogenous RING1B and PHC1. We stained the cells using antibodies against YFP (green), RING1B (magenta), PHC1 (magenta), and H3K27me3 (magenta). Overlay images are shown. Scale bars, 10 μm. e, confocal fluorescence images of immunostained RING1B and PHC1 in Cbx2−/− mES cells as well as in YFP-CBX2/Cbx2−/− mES cells. We stained the cells using antibodies against YFP (green), RING1B (magenta), and PHC1 (magenta). Overlay images are shown. Scale bars, 10 μm. f, representative FRAP images of YFP-CBX2 stably expressed in WT mES cells. The images were taken before (Pre-b) and after (Post-b) photobleaching. The condensate that was bleached is indicated by a white arrowhead. Scale bar, 10 μm. g, FRAP curve of YFP-CBX2 in WT mES cells that stably express YFP-CBX2. The FRAP curve was obtained from averaging data from 10 cells. Error bars represent S.D. h, epifluorescence imaging of YFP-CBX2 condensates isolated from cells. We cross-linked cells stably expressing YFP-CBX2 with formaldehyde. Lysate was prepared. Both lysate and resuspended pellet contained YFP-CBX2 condensates; however, the supernatant did not have condensates. Scale bars, 2.0 μm.

