Figure 2.
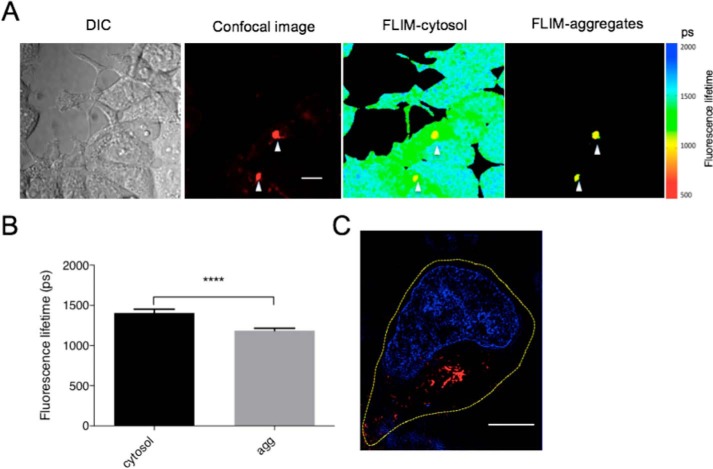
FLIM reveals different aggregation states of Arctic Aβ42 mutant protein. A, Arctic mutant–expressing cells were induced for 48 h. The left panel shows fluorescence intensity of the samples by confocal microscopy, and the middle panel shows the fluorescence lifetime of whole cells by single-photon-count FLIM. The right panel shows the fluorescence lifetime of aggregates indicated by white arrows in the left panel. Scale bar, 10 μm. DIC, differential interference contrast. B, mean fluorescence lifetime of intracellular Arctic mutant fragments in cytosol determined from aggregates (agg) in multiple images (n = 9). Error bars correspond to S.D. **** indicates a p value <0.0001 in Student's t test. C, a representative cell containing aggregates imaged by SIM 48 h after induction. The nucleus was stained with Hoechst 33342 (blue). The yellow dashed line shows the outline of the cell. Scale bar, 5 μm.

