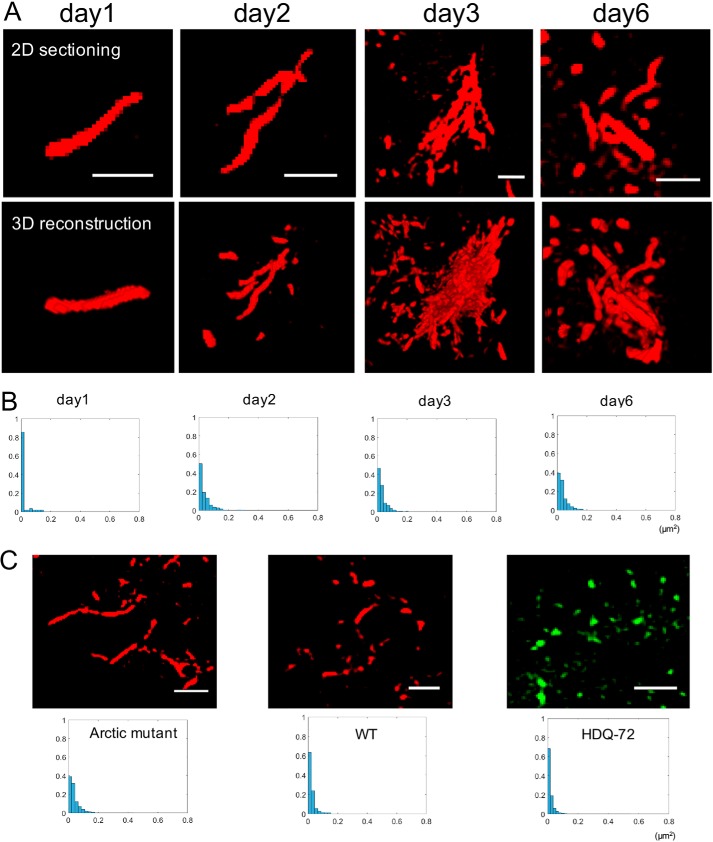
Figure 3.
Structural progression of intracellular Arctic mutant aggregates. A, 3D-SIM demonstrates representative Arctic mutant fibrils and fibril bundles formed inside cells at different times after tetracycline induction. Upper series of panels, 2D sectioning slice of the aggregates; lower series of panels, projected view from a 3D rendering of the above. Scale bar, 1 μm. B, size distribution profile of aggregates at different time points. Aggregates from at least three images of each time point were analyzed. y axis, proportion; x axis, aggregate size (μm2). C, morphology and size comparison of aggregates formed by three different aggregation-prone proteins: mCherry-Aβ42(E22G), mCherry-Aβ42(WT), and HDQ72-EGFP. Aggregates from at least three images of each cell line were analyzed. Upper panel, sectioning slice of aggregates by SIM. Lower panel, size distribution profile of aggregates at the same time point (6 days after gene induction).

