Figure 4.
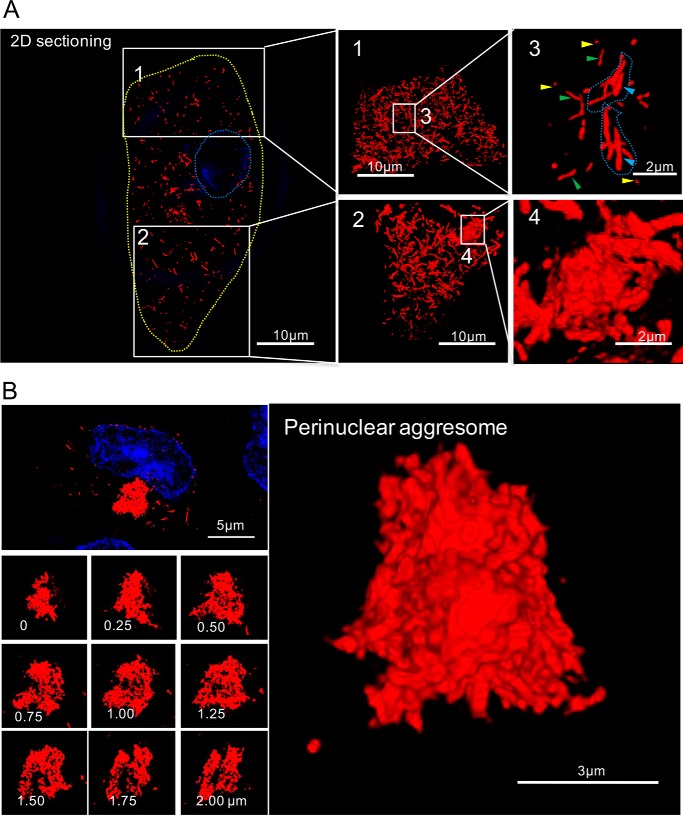
Super-resolved structures of intracellular Arctic mutant aggregates. A, left, a section slice showing an Arctic mutant–expressing cell containing numerous fibrillary fragments, which are in different states of aggregation in the cytosol. The nucleus was stained with Hoechst 33342 (blue and outlined with a blue dashed line). The yellow dashed line shows the outline of the cell. The zoomed regions are numbered 1–4. Middle and right panels are the projected views from 3D rendering. Image 3 shows oligomers (yellow arrows), single fibrils (green arrows), and fibril bundles (blue arrows). Image 4 shows a fibril cluster. B, high-resolution SIM images of an aggresome. The nucleus was stained with Hoechst 33342 (blue). Left panel, z-stack sectioning slice of an aggresome that contains tightly connected fibrillary fragments. Right panel, projected view from 3D rendering of the images from the left panel.

