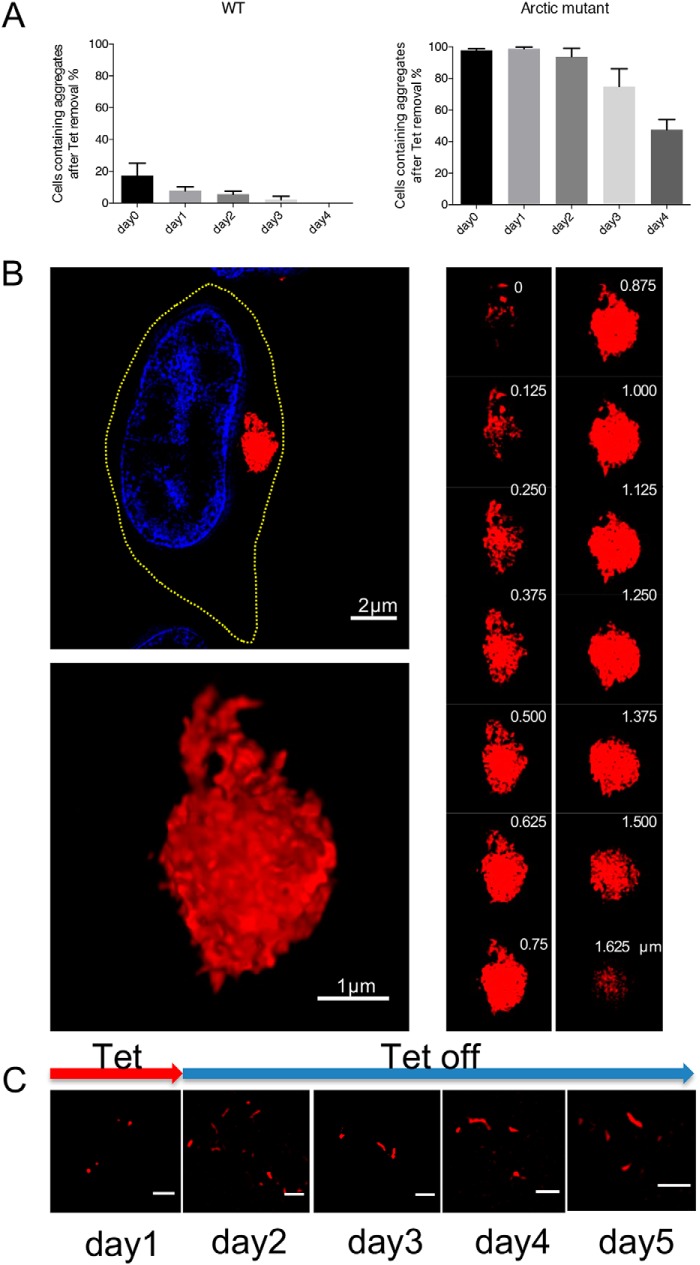
Figure 5.
Arctic mutant aggresomes are resistant to degradation. A, proportion of cells with aggregates (both cytoplasmic aggregates and aggresomes) after the expression of WT or Arctic mutant Aβ42 expression was switched off. Cells were counted at different time points (0, 1, 2, 3, and 4 days) after the medium was replaced with inducer-free medium. Three independent experiments were performed with 200 cells assessed per experiment. Error bars represent S.D. B, high-resolution SIM images of an aggresome 4 days after gene expression was switched off. Upper left, a sectioning slice of a cell containing an aggresome. The nucleus was stained with Hoechst 33342 (blue). The yellow dashed line shows the cell outline. Lower left, projected view from 3D rendering of the aggresome shown above. Right panel, z-stack sectioning slice of the same aggresome, which consists of compacted fibrillary fragments. The z-stack depth is labeled in the upper right in each image. C, 2D-SIM demonstrates persistence of intracellular Arctic mutant fibrils over several days after a short (24-h) pulse of mCherry-Aβ42(E22G) gene expression. The red arrow indicates the presence of tetracycline (Tet) on day 1 in the culture medium, whereas tetracycline is not present on subsequent days. Scale bar, 1 μm.

