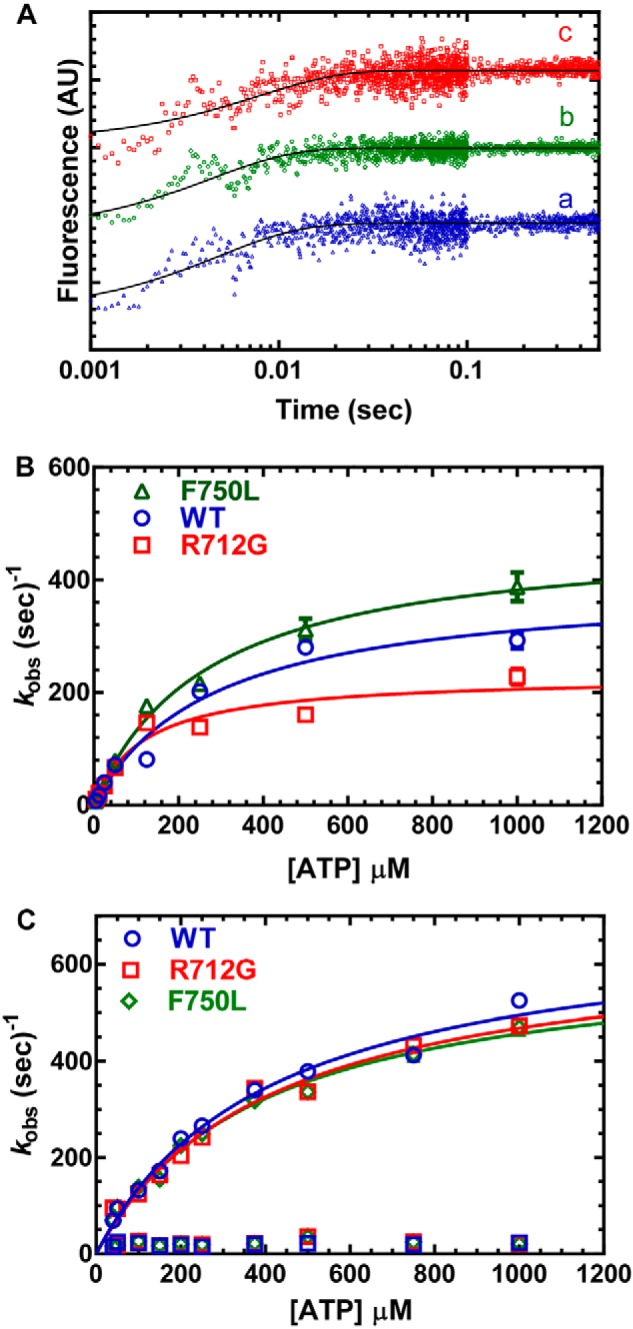
Figure 3.

ATP binding and hydrolysis. A, MV (1 μm) was mixed with varying concentrations of ATP, and the tryptophan fluorescence increase was monitored as a function of time and fit to a single-exponential function. B, the observed rate constants were hyperbolically dependent on ATP concentration. C, the rate of ATP-induced dissociation from pyrene actin was examined by mixing MV:pyrene actin (0.25 μm) with varying concentrations of ATP. The fluorescence transients were fit to a two-exponential function with the fast phase being hyperbolically dependent on ATP concentration. The slow phase was a small component (5–10%) of the fluorescence signal and similar at each actin concentration (10–20 s−1). Fluorescence is reported in arbitrary units (AU).
