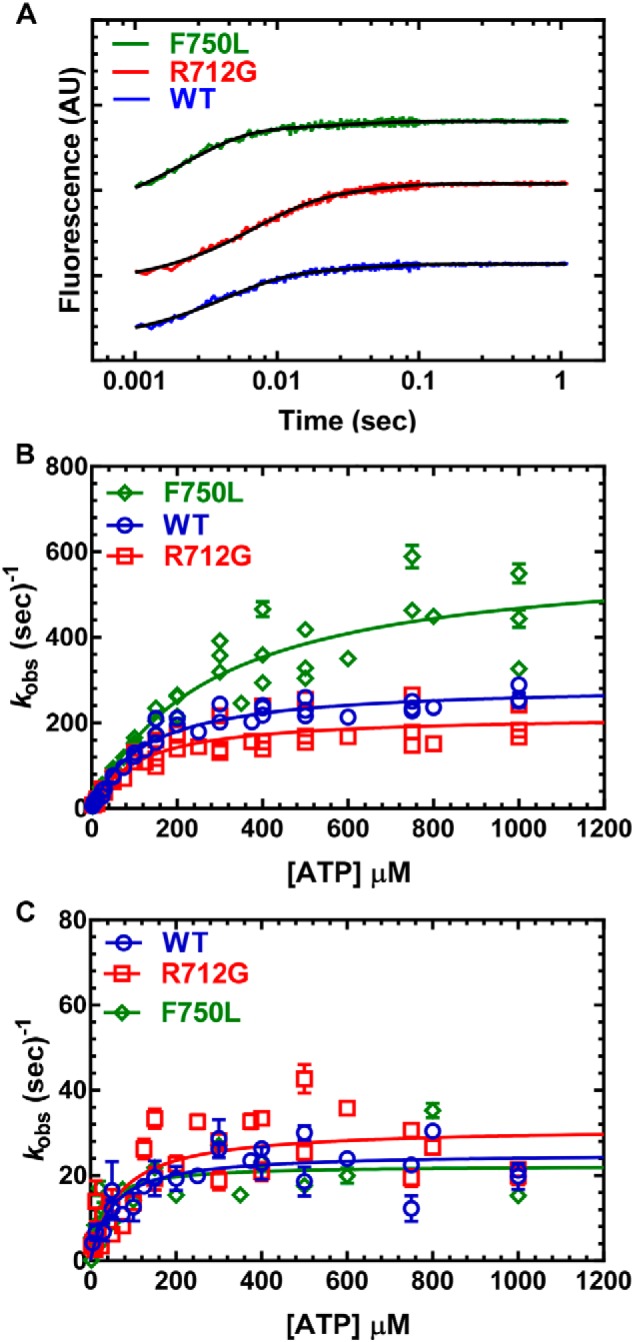
Figure 5.

Recovery stroke. 0.25 μm MV FlAsH.QSY-CaM was mixed with increasing concentrations of ATP, and the decrease in the FRET signal was monitored by following the increase in FlAsH fluorescence. A, the fluorescence transients were best fit by a two-exponential function at all ATP concentrations. B, the fast phase (recovery stroke) was the majority of the fluorescence signal (≥90%) and was hyperbolically dependent on ATP concentration. C, the slow phase was also hyperbolically dependent on ATP concentration. Fluorescence is reported in arbitrary units (AU).
