Figure 7.
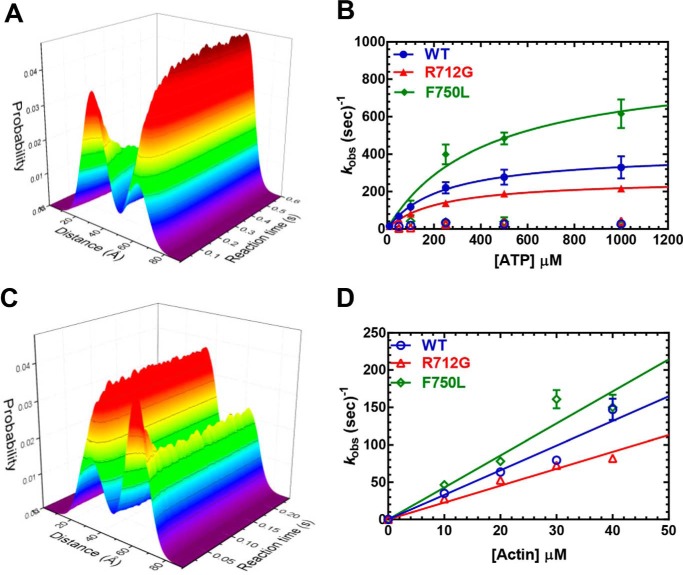
Transient time-resolved FRET: time-resolved fluorescence waveform acquisition of structural kinetics. A, (TR)2FRET of the recovery stroke. The fluorescence of 160 nm MV FlAsH.QSY-CaM changes upon rapid stopped-flow mixing with varying concentrations of ATP (0.01 mm shown). Both the peak fluorescence intensity and the waveform shape change over the reaction time. The three-dimensional plot depicts the nanosecond-resolved waveforms (xy-plane) evolving with reaction time (z axis). Each waveform was fit to a two-Gaussian distance distribution. The three-dimensional plot depicts each distance distribution (xy-plane) evolving with reaction time (z axis). B, the summary of rate constants from fitting the recovery-stroke (TR)2FRET data to a double-exponential function. C, (TR)2FRET of the power stroke. 160 nm MV and 10 μm ATP were mixed with 5.0 mm ADP and varying actin concentrations. D, summary of rate constants from fitting the power-stroke (TR)2FRET data to a single-exponential function.

