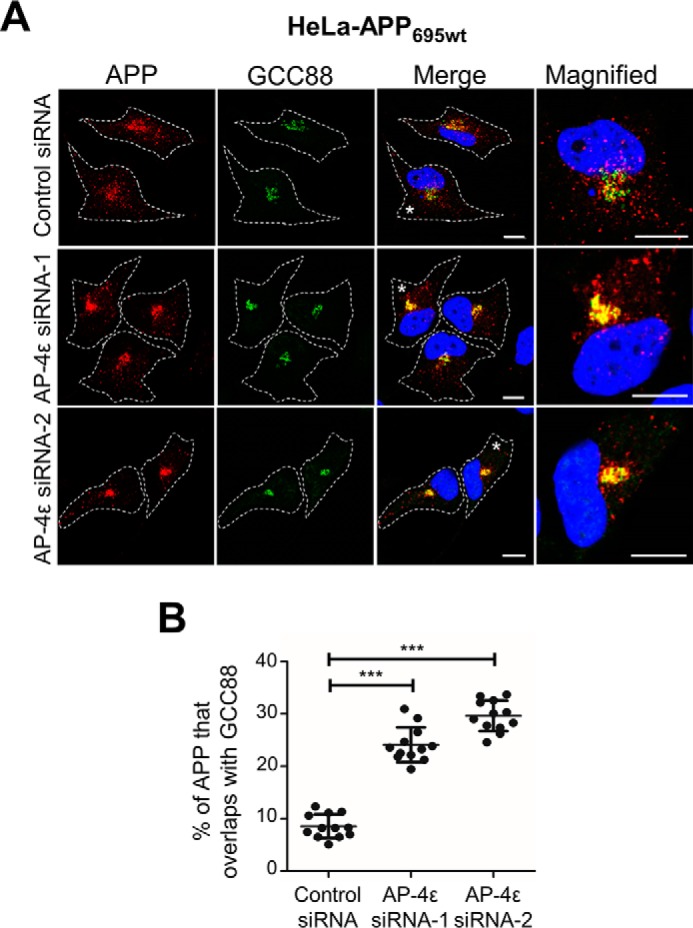
Figure 2.

AP-4ϵ depletion results in APP accumulation in the TGN. A, HeLa–APP695WT cells were transfected with either control siRNA, AP-4ϵ siRNA-1, or AP-4ϵ siRNA-2, as indicated, for 72 h. Monolayers were fixed and stained with mouse anti-human APP antibodies (clone NAB228) (red), rabbit anti-GCC88 antibodies (green) as a TGN marker, and DAPI (blue). Higher magnification of the merged images of the cells marked * are also shown. Bars represent 10 μm. B, percentage of APP at the TGN was calculated as a percentage of total APP pixels that overlapped with GCC88 using the OBCOL plugin on ImageJ. Data are represented as the mean ± S.D. of three independent experiments (n = 12) and analyzed by unpaired, two-tailed Student's t test. ***, p < 0.001.
