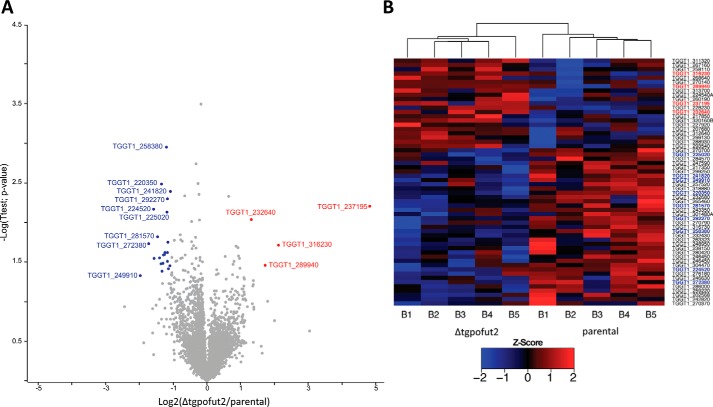
Figure 5.
Quantitative proteomic analysis of Δtgpofut2 compared with the parental line. Label-free quantification of isolated tachyzoites was undertaken to compare Δtgpofut2 with the parental line. A, identified proteins are presented as a volcano plot depicting mean LFQ intensity ratios of Δtgpofut2 versus the parental line plotted against logarithmic t test p values from five biological experiments of each line. B, heat map of z-scored values of the proteins observed to change between the Δtgpofut2 and the parental line, demonstrating the consistency of these changes across experiments.

