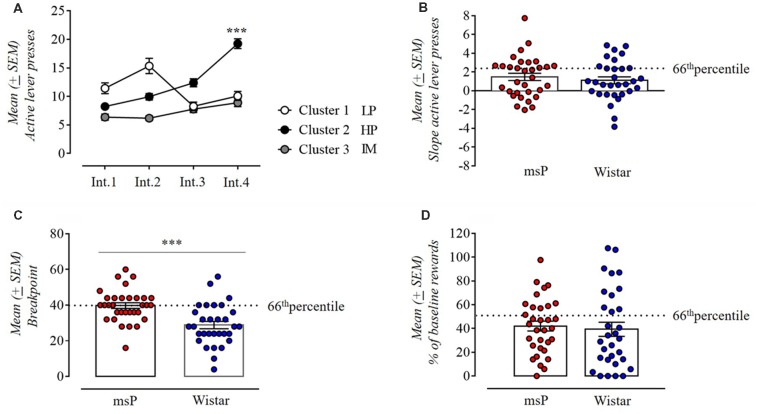
Figure 3.
(A) K-means clustering with three clusters of the total population (msP and Wistar rats) used to classify animals based on their performance in the drug free period and using as variables the 44 daily sessions divided in four intervals of 11 days each. Cluster 1 defined as low persistent (LP; 14 cases: 8 msP and 6 Wistar rats); cluster 2 defined as high persistent (HP; 20 cases: 12 msP and 8 Wistar rats); cluster 3 defined as intermediate (29 cases: 12 msP and 17 Wistar rats). Values are presented as mean (±SEM). ***p < 0.001, significant between Int.1 and Int.4 in Cluster 2. (B) Slope values of the number of active lever presses during the drug free period in msP and Wistar rats over the 44 daily sessions divided in four intervals of 11 days each (Int.1, Int.2, Int.3 and Int.4 as points of the slope line). Values are presented as mean (±SEM). (C) Motivation for 10% ethanol measured by the break point during a progressive-ratio (PR) schedule of reinforcement in msP and Wistar rats. Values are presented as mean (±SEM). ***p < 0.001, significant as compared to msP and Wistar rats in the break point achieved. (D) Number of reinforcements in a 10 min foot-shock session for msP and Wistar rats represented as percentage of the baseline (average of the first 10 min of days 42–44). Values are presented as mean (±SEM). The dotted line indicates the 66th percentile of distribution of (B–D).

