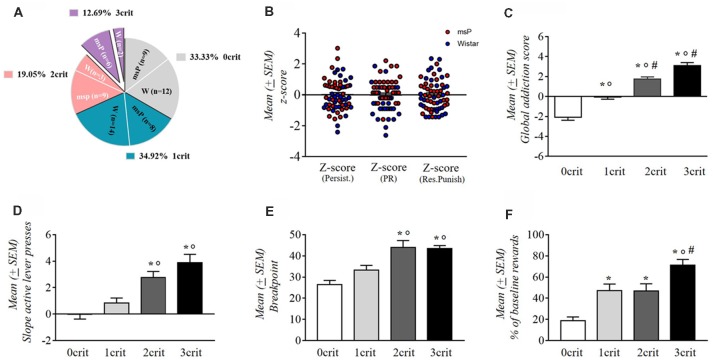
Figure 4.
(A) Percentage of the total population (n = 63) of rats positive for zero (0crit), one (1crit), two (2crit) or three (3crit) addiction like criteria. (B) Normalized scores (z-scores) for each of the three criteria in msP and wistar rats. Values are presented as mean (±SEM). (C) Addiction score of 0crit, 1crit (addiction resistant rats) 2crit and 3crit (addiction prone rats). Values are presented as mean (±SEM). *p < 0.001, significant as compared to 0crit and 1crit, 2crit, 3crit rats in the global addiction score (GAS). °p < 0.001 significant as compared to 1crit and 2crit, 3crit rats in the GAS, #p < 0.05 significant as compared to 2crit vs. 3crit rats in the GAS. (D) Persistence of response for alcohol during the no-drug period. Values are presented as mean (±SEM). *p < 0.001, significant as compared to 0crit and 2crit, 3crit rats. °p < 0.01 significant as compared to 1crit and 2crit rats and °p < 0.001 as compared to 1crit and 3crit rats. (E) Motivation for alcohol during the PR schedule. Values are presented as mean (±SEM). *p < 0.001, significant as compared to 0crit and 2crit, 3crit rats. °p < 0.05 significant as compared to 1crit and 2crit rats and °p < 0.01 as compared to 1crit and 3crit rats. (F) Resistance to punishment during the punished reward test. Values are presented as mean (±SEM). *p < 0.001 significant as compared to 0crit and 3crit rats. *p < 0.01, significant as compared to 0crit and 1crit, 2crit rats. °p < 0.01 significant as compared to 1crit and 3crit rats, #p < 0.05 significant as compared to 2crit and 3crit rats.

