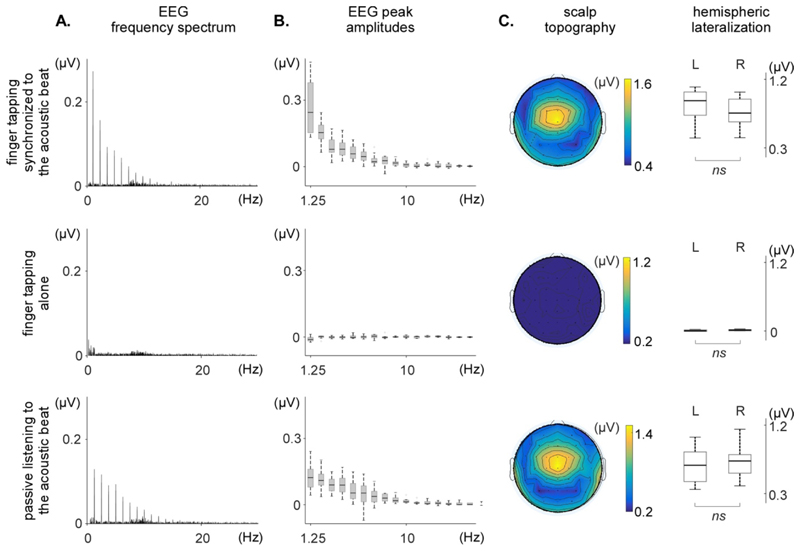
Figure 5. Frequency-domain analysis of the non-time-warped EEG signals obtained in each of the three conditions (finger tapping synchronized to the acoustic beat, finger tapping alone, and passive listening to the acoustic beat).
A. Frequency spectrum of the EEG signals, averaged across participants and across the 64 EEG channels. Note the clear peaks at beat frequency and harmonics in each of the EEG spectra, except for the EEG signals recorded in the finger tapping alone condition. B. Peak amplitude at the fundamental frequency and harmonics, across participants (median, lower/upper quartile and minimum/maximum values). C. Scalp topography and hemispheric lateralization of the periodic EEG response (sum of the spectrum amplitude at beat frequency and harmonics significantly greater than zero). The non-time-warped signals obtained in the finger taping synchronized to the acoustic beat and the passive listening conditions show similar scalp topographies, maximal over fronto-central electrodes, and symmetrically distributed over the two hemispheres (L: left; R: right). No significant activity is identified in the finger tapping alone condition.

