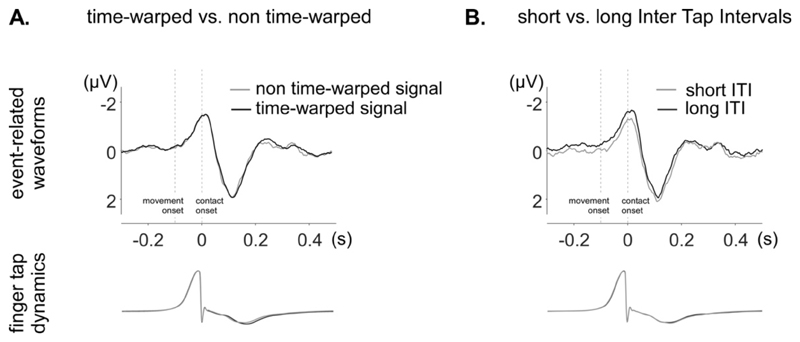
Figure 7. Time-domain analysis of the unitary EEG waveforms obtained in the tapping alone condition.
The average waveforms (electrode Cz) were obtained by aligning EEG segments to the onsets of the contact of the fingertip with the table. The finger tap dynamics recorded by the movement sensor are shown in the lower part of the figure, also averaged relative to contact onset. A. Average waveform of the non-time-warped EEG signal (grey) and the time-warped EEG signal (black). In both non-time-warped and time-warped signals, a clear EEG response is observed, time-locked to the contact onset, and consisting of a negative peak concomitant to the tapping, followed by a positive peak maximal approximately 110 ms after tapping. The non-time-warped and time-warped waveforms are highly similar, except for a slight smoothing of rapid activities in the time-warped signal. B. Waveforms obtained by averaging EEG segments separately for short ITIs (grey) and long ITIs (black). The period preceding contact onset was more negative for long ITIs as compared to short ITIs. Furthermore, the negative peak concomitant to the finger contact was broader.

