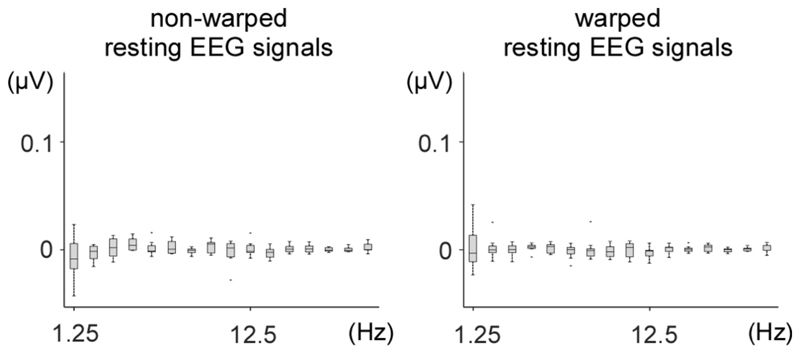
Figure 8. Frequency-domain analysis of non-time-warped and time-warped resting EEG data.
The time-warping procedure was applied to resting EEG data using the tapping latencies of the nine participants in the finger-tapping alone task, with an average 800 ms ITI. The graphs show the peak amplitudes at the fundamental frequency and its harmonics, across participants (median, lower/upper quartile and minimum/maximum values). Time-warping did not introduce any artefactual enhancement of peak amplitude at those frequencies.

