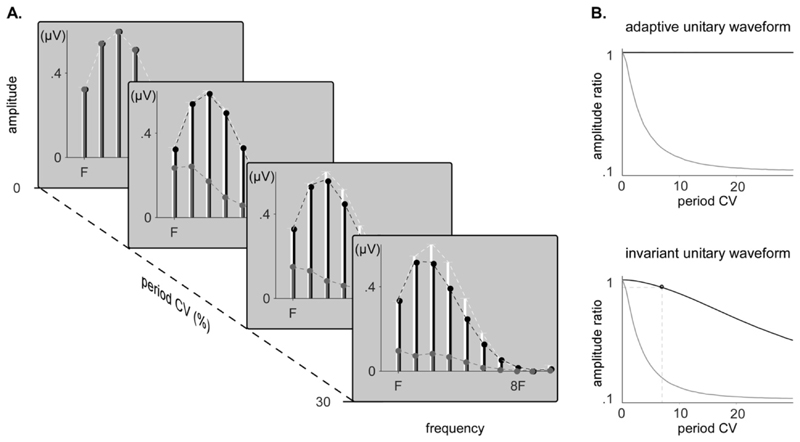
Figure 9. Amplitude recovery of original and tested synthetic signals.
A. Amplitude of the peaks measured in the spectra of strictly-periodic simulated EEG signals (white), non-strictly-periodic simulated EEG signals with a unitary waveform of invariant shape (grey) and time-warped non-strictly-periodic simulated EEG signals with a unitary waveform of invariant shape (black), for increasing coefficients of variation (CV) of the period fluctuation. B. Amplitude ratio between both time-warped (black) or non-time-warped (grey) non-strictly periodic signals and the strictly periodic signals, when the unitary waveform dynamically adapts to the period fluctuations or stays invariant and independent to the period fluctuations.

