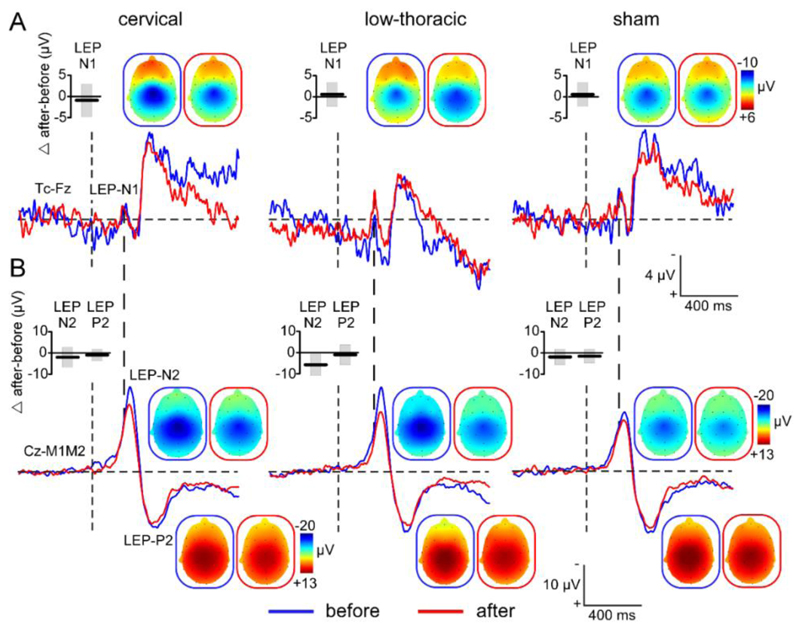
Figure 3.4.
Grand-average waveforms of the ERPs elicited by nociceptive laser stimulation delivered on the feet. ERPs waveforms obtained after stimulation of the feet are shown before (blue) and after (red) applying cervical, low-thoracic and sham tsDCS. The early latency LEP-N1 component is shown at the contralateral temporal electrode (Tc) vs. Fz (panel A). The LEP-N2 and LEP-P2 components are shown at Cz vs. M1M2 (panel B). The scalp topographies of the different LEP components are shown in the blue (before tsDCS) and red (after tsDCS) frames. Box plots represent the group-level average ± SD of the difference (Δ after - before tsDCS) in magnitude of the three LEP components.

