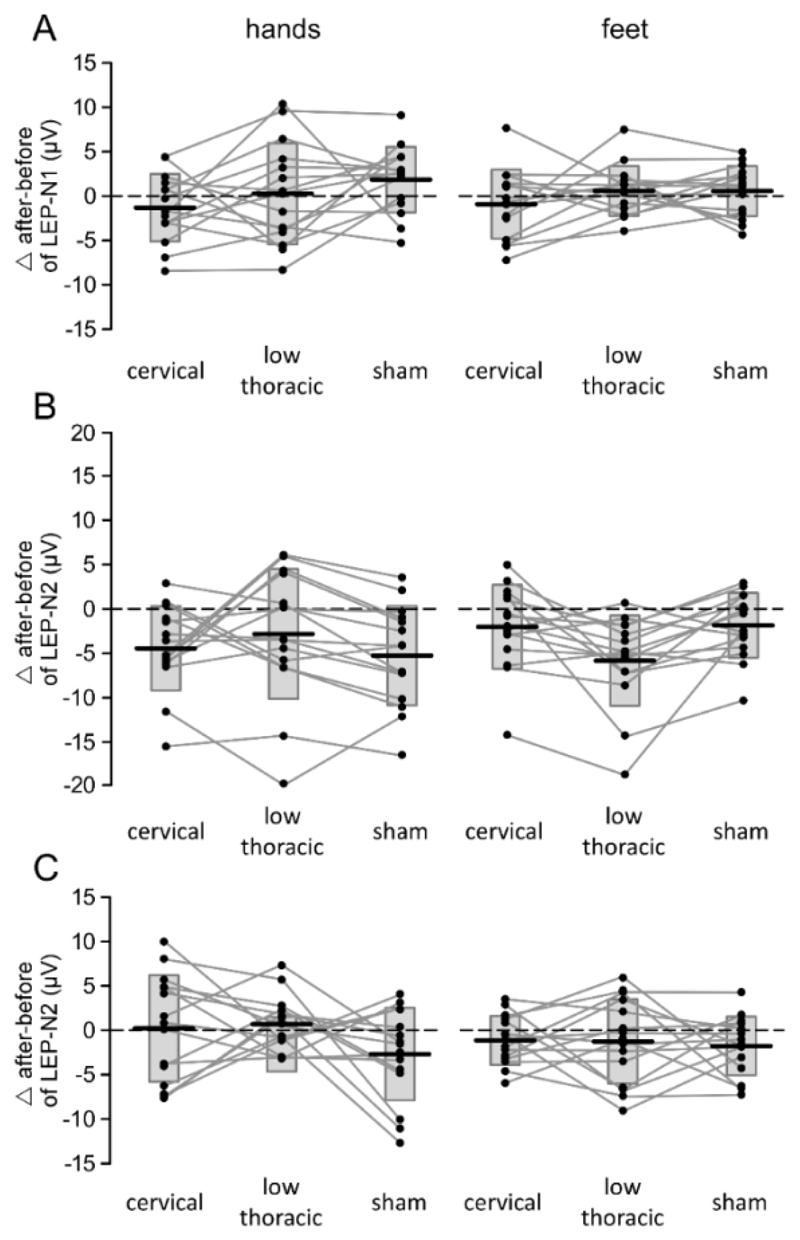
Figure 3.5.
Effect of cervical tsDCS, low-thoracic tsDCS and sham tsDCS on the magnitude of LEP-N1 (panel A), LEP-N2 (panel B) and LEP-P2 (panel C) components of the ERPs elicited by nociceptive stimulation of the hands and feet. Subject-level differences are represented by the connecting lines and dots. Box plots represent the group-level average ± SD.

