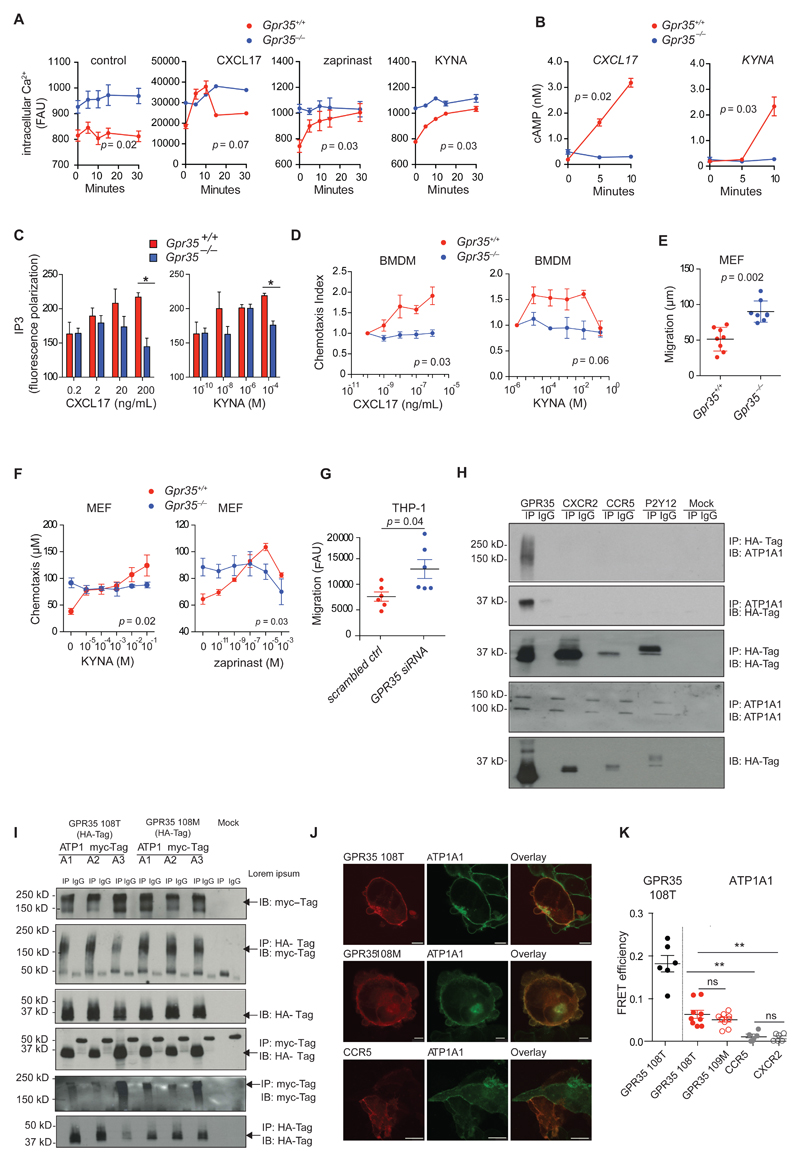
Figure 1. GPR35 deficiency re-sets resting cytoplasmic Ca2+ levels and GPR35 interacts with the α-chain of Na/K-ATPase.
A, Intracellular Ca2+ release in BMDMs at basal level (control) and after stimulation with CXCL17 (200 ng/mL), zaprinast (10 μM) or KYNA (300 μM); n=3 mice/group. B, Cyclic AMP (cAMP) production in BMDMs after stimulation with CXCL17 (200 ng/mL) or KYNA (300 μM); n=3 mice/group. C, Dose dependent inositol trisphosphate (IP3) generation in BMDMs after stimulation with CXCL17 (0.2 - 200 ng/mL) or KYNA (0.1 nM - 100 μM) for 20 min; n=3 mice/group. D, Directed migration (chemotaxis) of BMDMs towards different concentrations of CXCL17 and KYNA expressed as the chemotaxis index of stimulated compared to unstimulated cells; n=3 mice/group. E, Undirected migration of MEFs expressed as distance migrated into membrane; n=7 independent experiments for Gpr35+/+ and n=8 independent experiments for Gpr35-/-/group (we have used 3 Gpr35+/+ and 3 Gpr35-/- clones). F, Migratory distance of MEFs towards KYNA and Zaprinast; n=3 clones. G, Undirected migration of THP1 cells transfected with either GPR35 siRNA or scrambled siRNA (scrambled ctrl); n=6 independent experiments/group. Data are shown as mean ± s.e.m. Statistical significance calculated by Mann Whitney U test after Kruskal Wallis one-way ANOVA. H, Immunoprecipitates of HA tagged GPCRs probed for ATP1A1 (upper panel). Immunoprecipitates of ATP1A1 probed for HA (middle panel). Immunopreciptation using normal IgG antibody (IgG) used as a control. Western blot of HA-tagged GPCRs in whole cell lysates shown below. n=3 independent experiments I, Immunoprecipitates of HA-tagged GPR35108T or GPR35108M variant probed for myc-tagged ATP1A isoforms. Western Blot of myc-tagged ATP1A isoforms in whole cell lysates shown above (upper two panels). Immunoprecipitates of myc-tagged ATP1A isoforms (ATPA1-3) probed for HA. Western Blot of HA-tagged GPR35108T or GPR35108M variant in whole cell lysates shown above (lower two panels). Immunopreciptation using normal IgG antibody (IgG) used as a control. Arrows indicate the relevant band. n=3 independent experiments J, Fluorescent microscopy of ATP1A1-Venus (green) and Cerulean tagged GPR35108T or GPR35108M variant (red) co-expressed in HEK293 cells. Cerulean tagged CCR5 (red) used as a control. Scale bar, 5 μm. K, Fluorescence resonance energy transfer (FRET) efficiency measuring proximity of fluorescent-labelled GPR35108T or GPR35108M variant and ATP1A1 co-expressed in HEK293 cells. Fluorescent-labelled CCR5 and CXCR2 used as a control. GPR35 homo dimers used as a positive control. Data points represents individual acceptor photo bleaching events. n=6 events from 3 independent experiments for GPR35 homodimers and CCR5 and CXCR2 control, n=9 events from 3 independent experiments for GPR38108M and GPR35 108T. All data represented as mean ± s.e.m. Statistical significance was calculated by two-way ANOVA followed by post-hoc comparison of means, ** (p<0.01).

