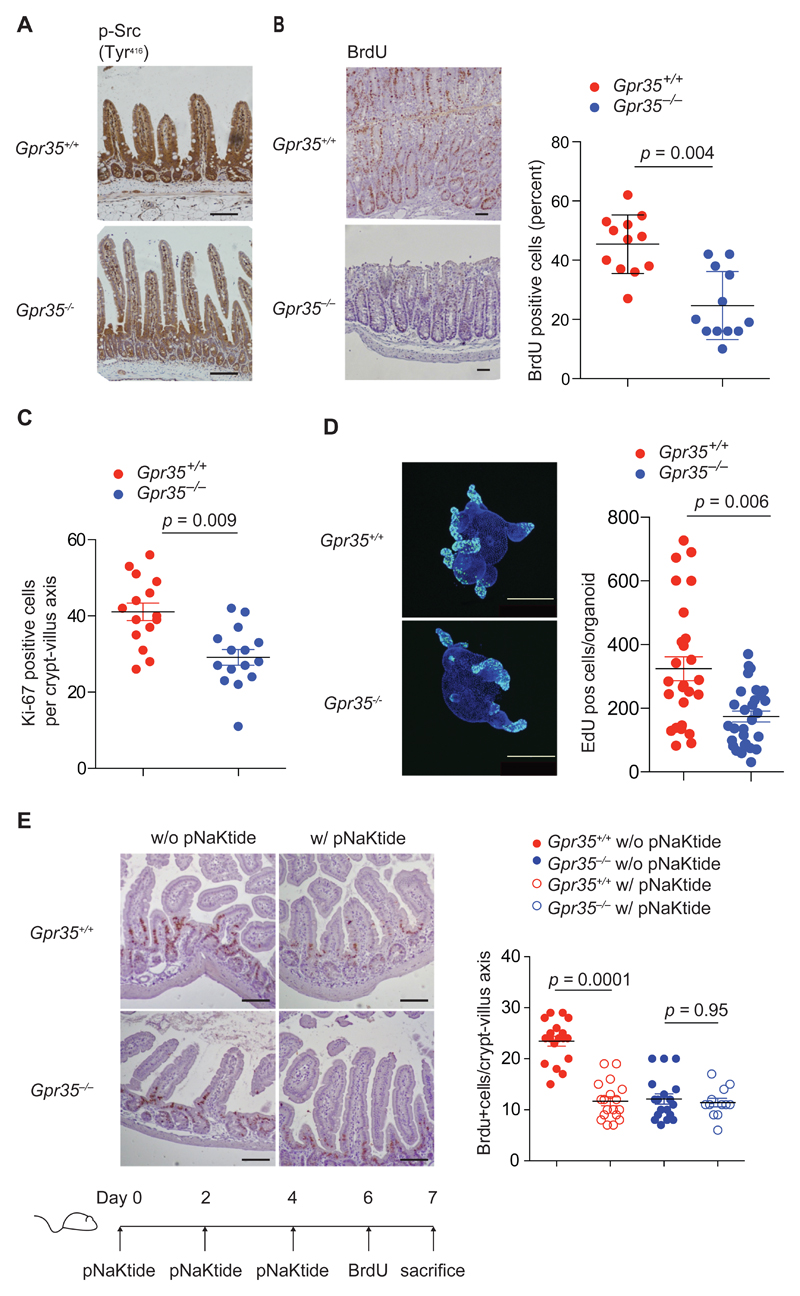
Figure 5. GPR35 maintains intestinal epithelial cell turnover under homeostatic conditions.
a, Immunohistochemistry of p-Src (Tyr416) in intestinal sections from Gpr35+/+ and Gpr35–/–mice. Representative images of 6 mice per group. Scale bars represent 100 μm. b, Immunohistochemistry of BrdU incorporation after a 24 hour pulse in intestinal sections from Gpr35+/+ and Gpr35–/– mice. Representative images (left panel). Quantification of cells staining positive for BrdU (right panel). Each data point represents one crypt villus axis from 3 individual mice per group. c, Quantification of cells staining positive for Ki-67 using immunohistochemistry in intestinal sections from Gpr35+/+ and Gpr35–/– mice. Each data point represents one crypt villus axis; n=3 mice per group. d, Representative immunofluorescent images of colonic organoid cultures stained with EdU (green) for proliferative cells (left panel). Quantification of EdU positive cells in Gpr35+/+ and Gpr35–/– organoids (right panel). Each data point represents one organoid. Scale bars, 250 μm; n=3 mice per group. e, Representative images showing immunohistochemistry of BrdU incorporation in intestinal sections of Gpr35+/+ and Gpr35–/– mice after treatment with pNaKtide. Scale bars 100 μm (left panel). Timeline of pNaKtide and BrdU injections shown below. Quantification of cells staining positive for BrdU using immunohistochemistry (right panel). Each data point represents one crypt villus axis; n=3 mice per group. All data represented as mean ± s.e.m. Statistical significance was calculated by Mann Whitney U after Kruskal Wallis.

