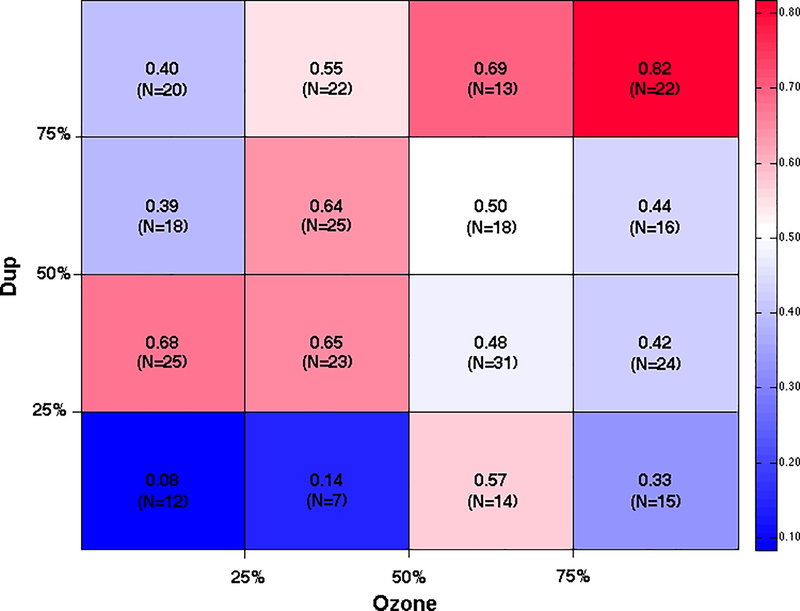
Figure 1. Proportion of individuals with autism by quartile of duplication CNV burden and average ozone exposure.
Each cell represents the intersection of two quartiles, one for duplication CNV burden and the other for average ozone exposure spanning the period from conception through the first two years of life. The proportion provided in each cell is the number of children with autism divided by the total number of individuals in that subgroup. N represents the total number of cases and controls in each cell. Red colors indicate higher proportion of children with autism while blue colors reflect lower proportions (see color bar on the right).

