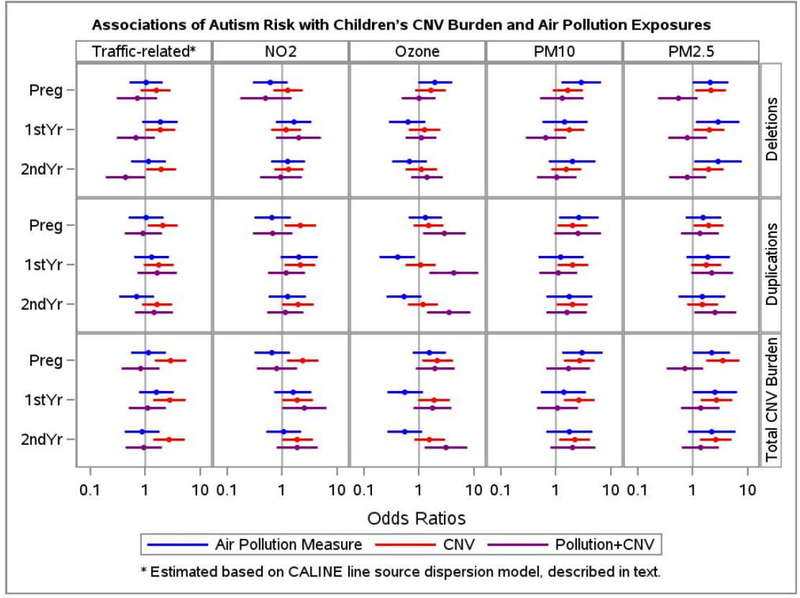
Figure 2. Estimated effects from genetic copy number variant (CNV) load and from air pollutant exposures, acting separately and in combination, on risk for autism.
Five broad columns represent five different types of air pollutant measurements, and three horizontal panels represent three different metrics for assessing CNV burden. For each cell representing a given air pollutant and CNV metric, three time periods for the air pollutant exposures are examined: pregnancy, 1st postnatal year, and 2nd postnatal year. The colored dots and bars are, respectively, the odds ratios and 95% confidence intervals for associations with autism versus typical development: a) comparing high to low environmental air pollutant exposures (blue) among those with low CNV burden; b) comparing high to low CNV burden (red) among those with low air pollutant exposures; and c) comparing the combined high CNV and high air pollutant exposures to the combined low CNV and low air pollutant exposures (purple). For both CNV burden (genetics) and air pollutant exposure (environment), high is defined as the upper quartile and low as the bottom three quartiles. A number of patterns emerge. These results confirm previous findings that the metric for CNV (red) with the strongest associations is the total CNV burden summing the lengths of both deletions and duplications (bottom panel of results), and reveal additional associations for air pollutants and their interactions with CNV.
These interaction results demonstrate the following: First, similar to the models based on continuous metrics for both CNV and air pollution, the interactions (purple) that emerge as most dramatic and with the strongest significance are for ozone, particularly when combined with duplications, but also with total CNV burden in the second year of life. Thus those in the upper quartile of both CNV and ozone exposure are at exceptionally high risk for ASD. Second, among those with low ozone, CNV (red) appears to have virtually no impact on ASD risk, and only impacts those with high ozone exposure.
Other observations worth noting are: a) The magnitude of genetically induced risk may depend on what exposures are simultaneously accounted for (e.g., for air pollutants during pregnancy, deletions show a stronger impact when adjusted for PM2.5 or the CALINE model of traffic-related pollution (25) than when adjusted for NO2). b) The environmental effects are remarkably consistent across metrics of CNV burden, but show greater variation by time period (e.g., for PM10, associations are stronger for pregnancy than later time periods, but this was not seen for PM2.5 or for NO2)..

