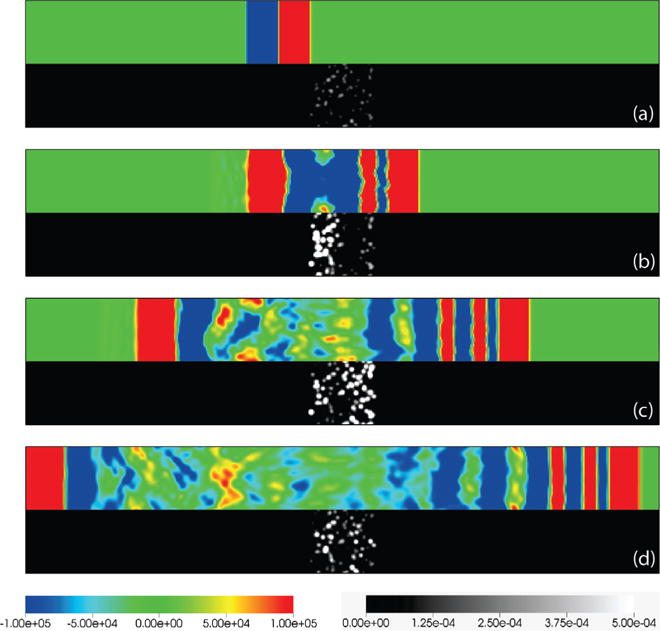
Figure 7.

Snapshots of the pressure (top half) and the void fraction (bottom half) contours on x − y plane in the range of x ∈ [−25, 25] and y ∈ [−2.5, 2.5] mm for three-dimensional simulation with β0 = 4.0 × 10⁻⁵. Note that the pressure is plotted at levels much smaller than the amplitude of the initial wave in order to highlighted the bubble-generated and scattered fields. (a) t = 12 μs, (b) 18 μs, (c) 24 μs and (d) 30 μs, respectively.
