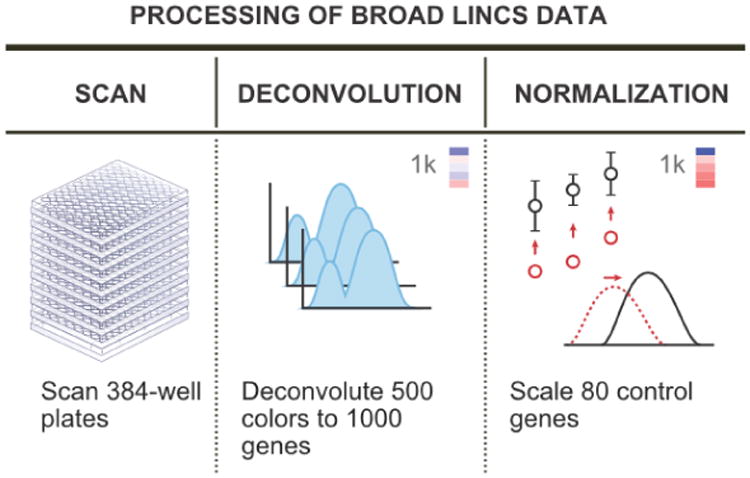
Fig 1.

The L1000 data preprocessing pipeline. The raw data are first measured from the beads in the experiments. Next, the data from each color of bead are deconvolved to assign expression values to the two genes which share that bead color. Finally, the data are normalized to yield directly comparable data across experiments. Figure adapted from an image on the Broad Institute LINCS cloud website (http://lincscloud.org/l1000).
