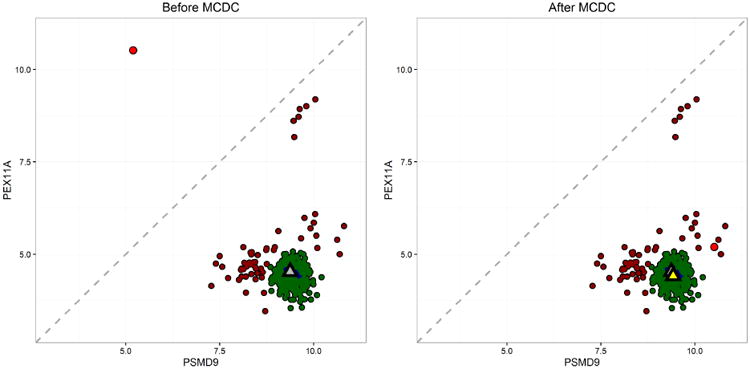
Fig 11.

Example 1 showing the results of applying MCDC to L1000 control data. MCDC chooses 3 clusters by BIC. On the left are the data before correction, and on the right are the same data after correction. Triangles indicate inferred mean - gray is the mean of all the data while yellow is the mean of the largest cluster found by MCDC.
