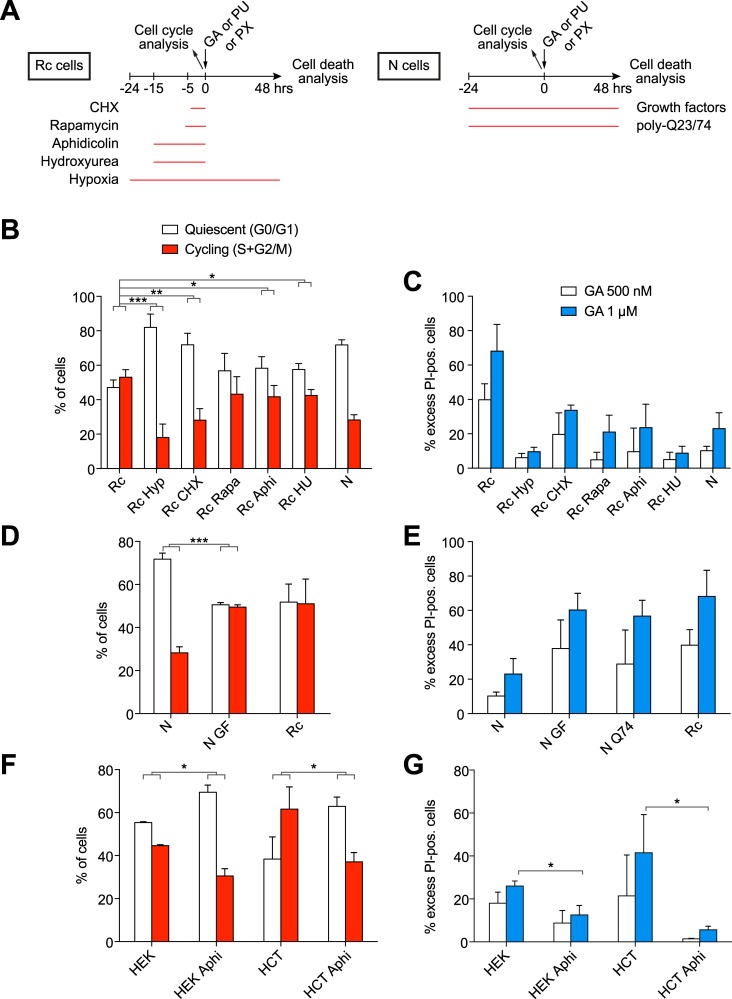
Fig 5. Manipulation of the cell cycle alters the sensitivity to the Hsp90 inhibitor GA.
(A) Scheme of the treatment and analysis regimen. (B) Histogram of the cell cycle distribution obtained by flow cytometry of indicated cells subjected to hypoxia (Hyp) or treated with cycloheximide (CHX), rapamycin (Rapa), aphidicolin (Aphi), hydroxyurea (HU); note that the hypoxia data (Rc Hyp) are duplicated here from Fig 4C for comparison. (C) GA-induced death of cells as indicated. (D) Histogram of the cell cycle distribution obtained by flow cytometry of indicated cells; N GF, N cells treated with growth factors. (E) GA-induced death of cells as indicated. N Q74 indicates cells transiently overexpressing EGFP-Q74. (F) Histogram of the cell cycle distribution obtained by flow cytometry of indicated cells; HEK, HEK293T cells; HCT, HCT116 cells. (G) GA-induced death of cells as indicated. Bars represent the means with standard errors of data from three independent experiments. *, significantly different with a p value <0.05; ** p value <0.05; *** p value <0.0005.

