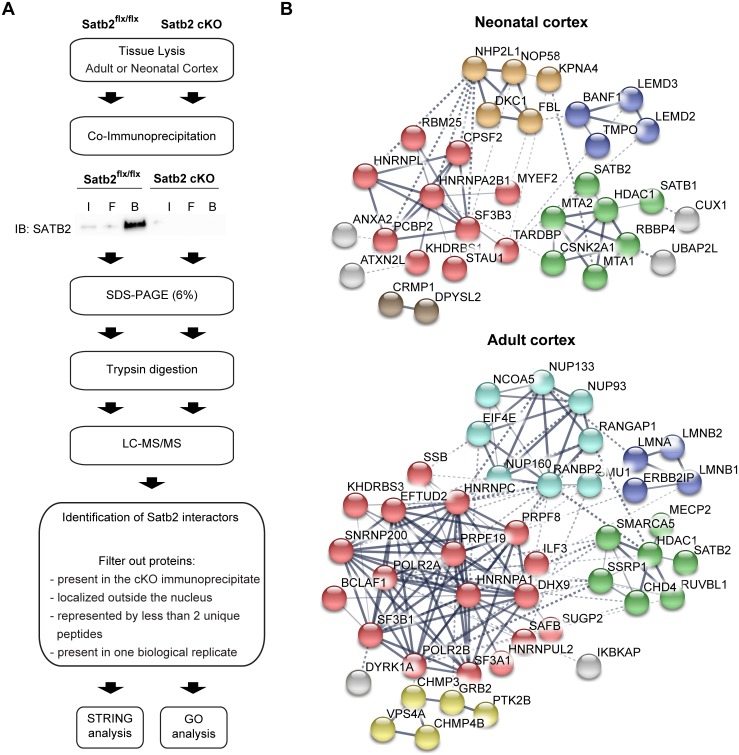
Fig 1. Proteomic analysis of SATB2 complexes in neonatal and adult mouse cortex.
(A) Schematic of experimental workflow. IP were performed using cortical lysates from control (Satb2flx/flx) and Satb2 cKO mice (adult cortex: Satb2flx/flx::CamK2a-Cre; neonatal cortex: Satb2flx/flx::Nes-Cre). (B) Protein-protein interaction networks of neonatal and adult cortex SATB2 interactomes, extracted from the STRING 10.5 database. Shown are only interactors that are connected within a network. Line thickness indicates the strength of data support. Clusters identified by k-means clustering are shown in different colors: red, RNA binding/processing proteins; green, HDAC1/NURD complex-associated proteins; dark blue, nuclear lamina-associated proteins; light blue, nuclear pore complex; yellow, ESCRTIII complex-associated proteins; orange, nucleolar proteins; brown, CRMP1- DPYSL2 cluster; grey, proteins without clearly defined association.

