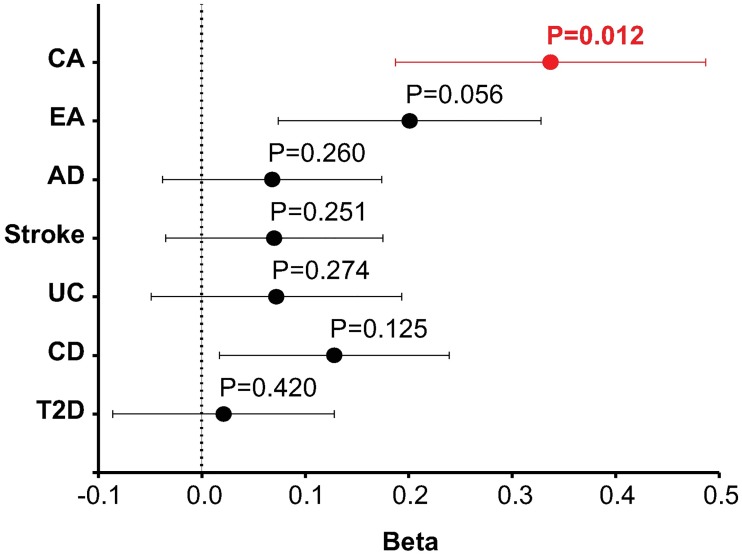
Fig 6. MAGMA GSA results for adult cortex SATB2 interactome using the summary statistics from multiple GWAS.
GSA of SATB2 interactome in CA and EA plus post-hoc analysis of 2 brain-related disease and 3 non-brain diseases GWAS datasets. Phenotypes are listed on the y-axis (CA, Cognitive Ability; EA, Educational Attainment; AD, Alzheimer’s disease; UC, Ulcerative Colitis; CD, Cardiovascular Disease; T2D, Type II Diabetes). P-values are shown above each data point, which represent beta values (x-axis). Horizontal bars indicate error bars (SE). Data also supplied in S6 Table.

