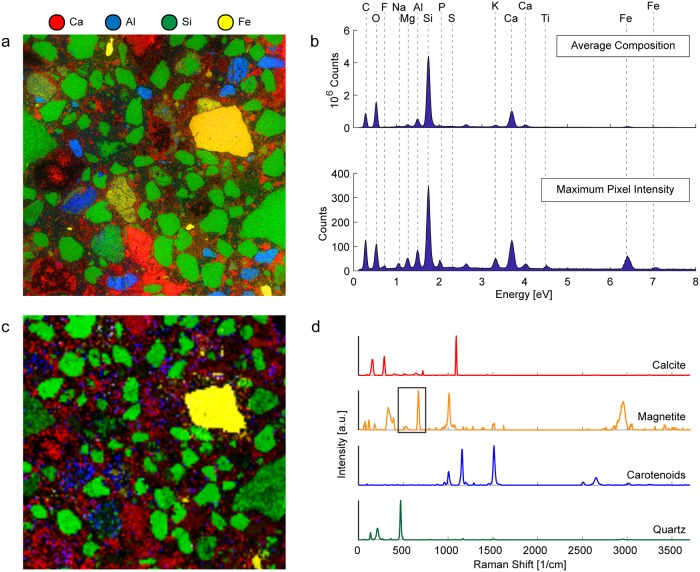
Fig 4. Correlative EDS and Raman characterization of a polished thin section of ancient Roman concrete.
(a) EDS element map of polished concrete sample and (b) EDS spectra of shown sample area indicating the total average composition of the sample (upper) and the combined maximum pixel intensities of the detected elements (lower). (c) Raman phase map of polished thin-section showing region measured using EDS and spatial distribution of (d) the constituent spectra (which are color-coded corresponding to the different displayed map phases).

