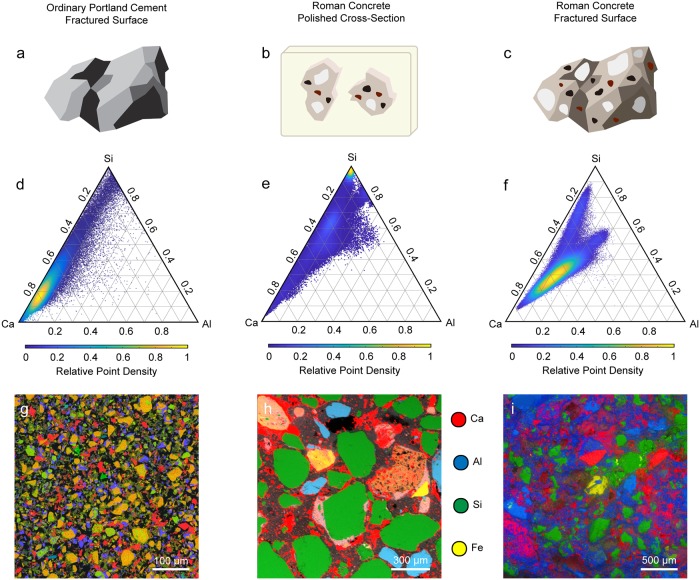
Fig 6. Ternary density plots and EDS element maps of ordinary Portland cement and ancient Roman concrete.
Schematics of (a) the fractured surface of an ordinary Portland cement sample, (b) the polished cross-section of ancient Roman concrete that has been embedded in resin and (c) the fractured surface of an ancient Roman concrete sample. Below the sample illustrations (upper row) are the ternary density plots (middle row) showing ratios of Ca to Si to Al at each pixel in the different EDS maps (bottom row). For each of the ternary density plots, the purple regions are most sparsely populated, and the yellow regions are most densely populated.

