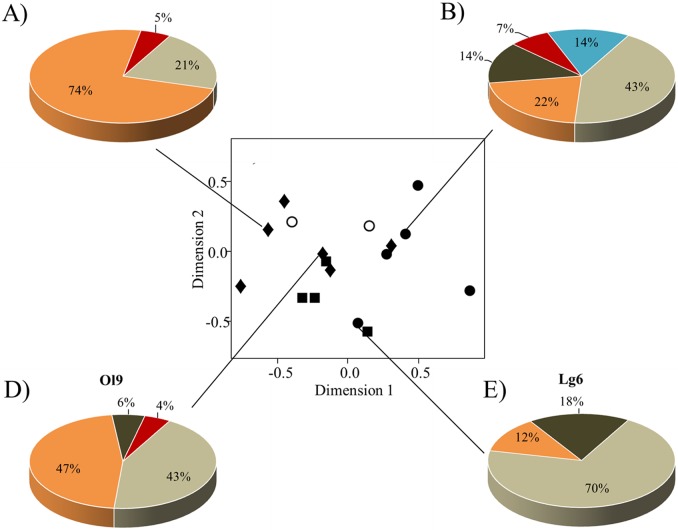
Fig 3. Variation in resin spectra collected by 16 colonies from four different apiaries/sites.
Bees collected varying amounts of up to five different types of resin (“ocher”, “orange”, “brown”, “red”, “clear”). Ordination figure (C) shows similarities among colonies from different sites based on Bray-Curtis dissimilarities between samples (stress value = 0.06). Sites are represented by different symbols: closed circle, “Lg”; closed diamond, “Ol”; closed square, “Gr”; open circle, “Ml” with each symbol representing a single colony (for meaning of abbreviations see Table 1). Circular charts (A–B) and C—D) display proportions of resin types collected by four examplary colonies from two different sites (site “Ol”: A) colony ID 8: N resin samples = 19, and B) ID 9: N = 88; site “Lg”: D) ID 4: N = 14 and E) ID 6: N = 40).

