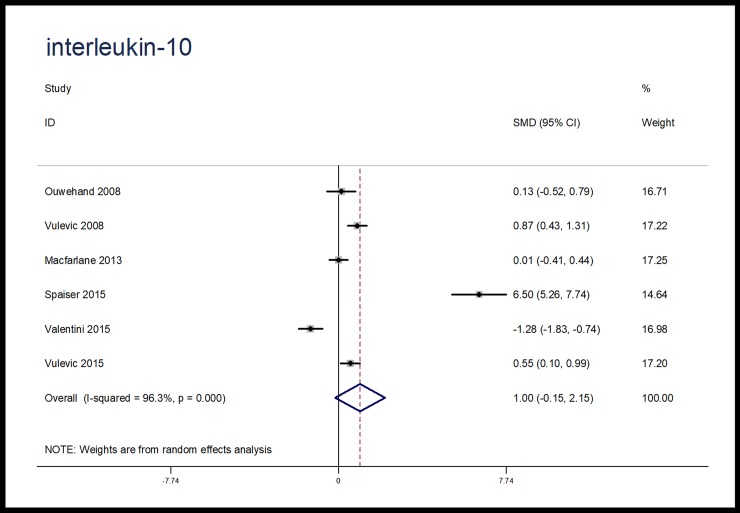
Fig 5. Forest plot for IL-10, microbiota-driven therapy vs. placebo.
IL-10, interleukin-10; SMD, standard mean difference; CI, confidence interval. In the forest plot, solid vertical line represents for ineffective line, and the dashed red line represents for standard mean difference between microbiota-driven group and placebo group.

