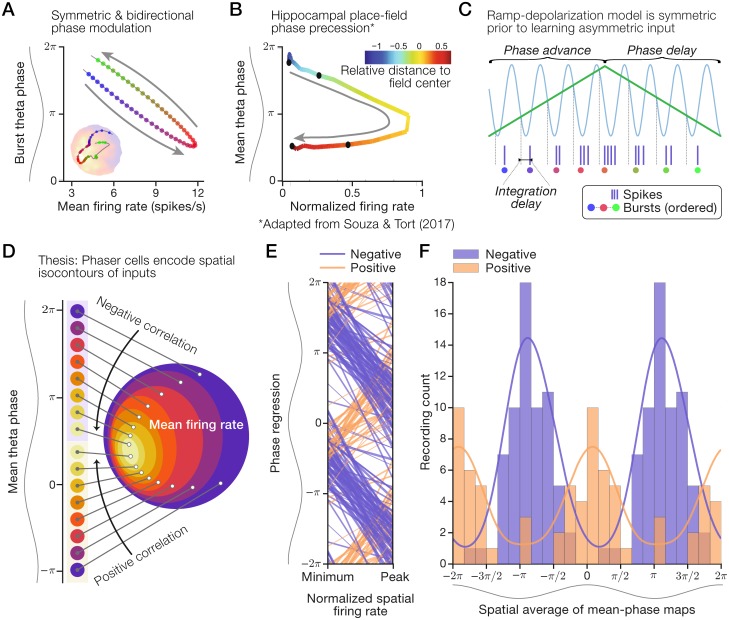
Fig 3. Mechanisms and temporal organization of the phaser cell code.
Our thesis is that phaser cell activity is distinct from hippocampal phase precession and encodes spatial isocontours, not specific locations. (A) Schematic of symmetric rate-phase coupling (cf. Fig 1E, right) that deflects in one direction and then retraces in the opposite direction as the animal moves through a high-activity region. Inset from Fig 1E for illustration. (B) Mean rate-phase relationship across normalized traversals of 1,071 place fields from Souza & Tort (2017) [43]. Arrow: unidirectionality of phase precession. (C) Schematic of ramp-depolarization model with symmetric inputs, as is the case prior to learning [8]. Sinusoid: theta inhibition; green line: depolarizing input. (D) Schematic of a spatial phase code modeled on the LS cell in Fig 1 in which theta phase (left) maps to an isocontour level of underlying spatial inputs reflected by mean firing rate (right). (E+F) Negative and positive phaser cell recordings were segregated by theta phase. Multiple theta cycles shown for clarity. (E) Rate-phase regressions across normalized mean firing-rates. Line width: thin, |r| < 1/3; medium, 1/3 ≤ |r| < 2/3; thick, |r| > 2/3. (F) Distributions of typical spike theta-phases computed as spatial averages. Histograms: positive composited over negative; lines: density estimates using a circular π/4 bandwidth Gaussian kernel. Panel (B) was adapted from figure 5B of Souza & Tort (2017) [43] as permitted by the CC-BY 4.0 International License (creativecommons.org/licenses/by/4.0/).

