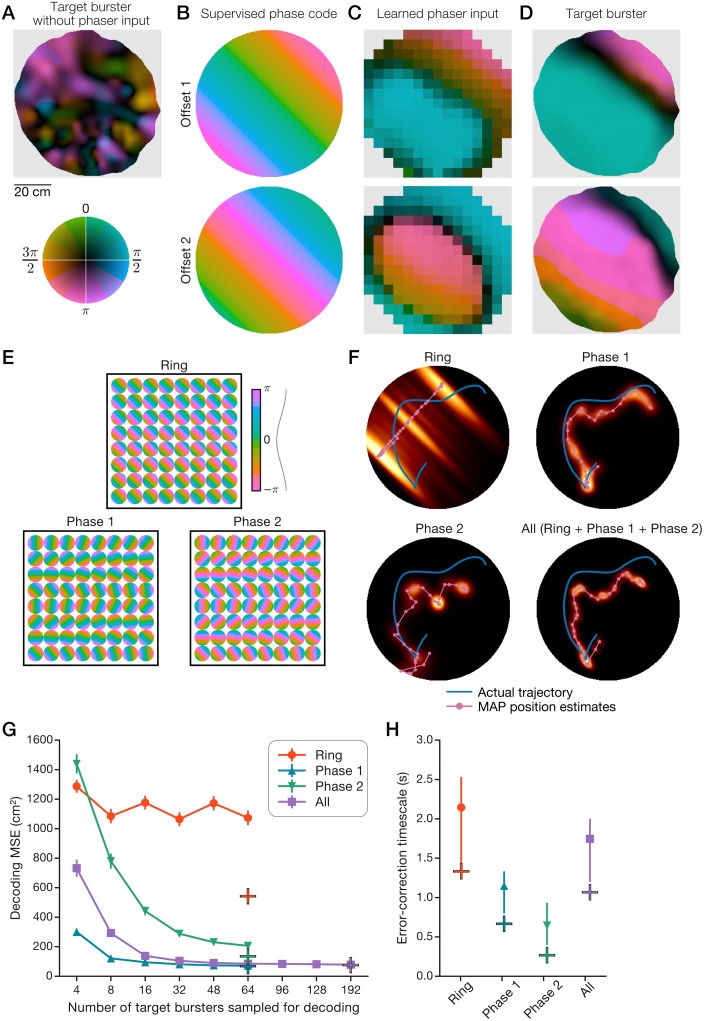
Fig 8. Realistic open-field phaser entrainment of path integration networks.
Simulations of 1,000 pairs of negative and positive phasers with generative 2D open-field spatial inputs (S10 Fig, panel A) entrained target cells (A-D) and networks (E-H). (A) Bursting phase map of a target neuron without phaser input. (B) Two supervised 2D phase codes with different phase offsets that emulate oscillatory path integration in the 45° direction. (C) 2D space-phase distributions of total kWTA-weighted phaser input to the target neuron (Table 4). (D) Phase maps of the target burster with phaser input. (E-H) Bayesian decoding of position from burst phase (Eq (13); Methods) of three collections of 64 target neurons representing path integration networks. (E) Supervised phase codes for each unit in the target networks. (F) Decoded sequences for an example 6-s trajectory for each target network (64 target units) or the combination of all three networks (192 target units). Heatmap: composited sequential posteriors; magenta line/circles: sequential MAP position estimates; blue line: actual trajectory. (G+H) Path-integration error-correction performance was quantified by decoding a benchmark 60-s trajectory from network activity and 100 bootstrapped unit samples of network activity. Plus symbols: network performance; curves: bootstrap mean; error bars: bootstrap s.e.m. (G) or 95% c.i. (H). (G) Decoded position error according to the number of decoded units. (H) The timescale of error-correction was measured as the HWHM of temporal auto-correlations of decoding error (Methods).

