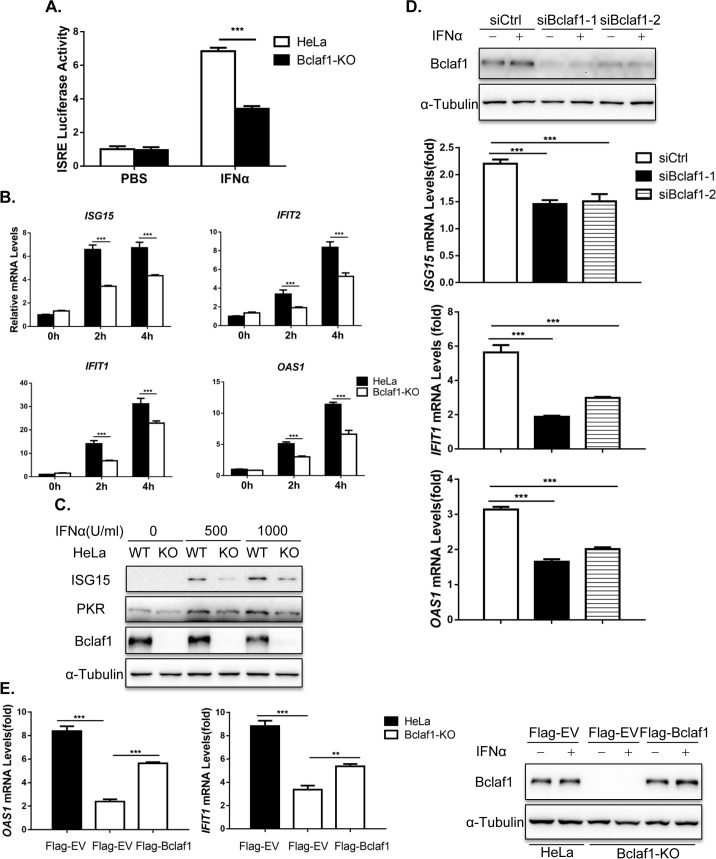
Fig 3. Bclaf1 facilitates IFNα-induced ISG expression.
(A) ISRE-luciferase assay in HeLa WT and HeLa Bclaf1-KO cells treated with human IFNα (500U/mL) for 10h. (B) qRT-PCR analysis of ISG15, IFIT1, IFIT2 and OAS1 mRNA levels in HeLa WT and HeLa Bclaf1-KO cells treated with human IFNα (500U/mL) for the indicated time. (C) IB analysis of ISG15 and PKR in HeLa WT and HeLa Bclaf1-KO cells treated with human IFNα for 12h. (D) qRT-PCR analysis of ISG15, IFIT1 and OAS1 mRNA levels in HEp-2 cells transfected with si-control or si-Bclaf1 followed by human IFNα (500U/mL) treatment for 4h. IB analyzed the knocking down efficiency. (E) qRT-PCR analysis of OAS1 and IFIT1 mRNA levels in indicated HeLa cells transfected Flag-tagged EV or Bclaf1 expression plasmids followed by PBS or human IFNα (500U/mL) treatment for 4h. IB analyzed the expression of Bclaf1. Data are shown as mean ± SD of three independent experiments. Statistical analysis was performed by the two-way ANOVA test (A and B) and one-way ANOVA test (D and E). **p<0.01; ***p<0.001.

