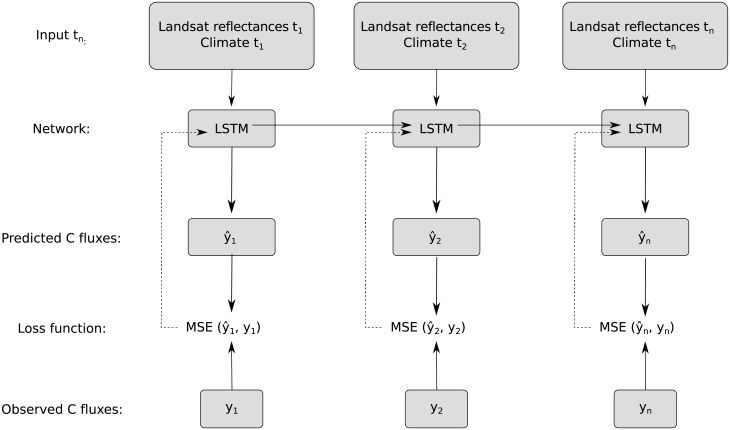
Fig 2. Flowchart of the proposed LSTM approach.
Figure adapted from [61]. Each individual timestep is a monthly observation for the period 1982 to 2015. Landsat surface reflectances correspond to the seven spectral bands of the Landsat product; i.e. blue, green, red, near infrared, shortwave infrared 1, shortwave infrared 2, and thermal infrared. Climate corresponds to air temperature, precipitation, global radiation, and vapor pressure deficit. At each time step, an LSTM layer containing a set of cells or hidden neurons (10, 20, or 30) processes information based on the input of the current and of all previous observations. Predictions of net ecosystem exchange were performed at each monthly timestep by using information from both current and previous observations. The loss function was only calculated when net ecosystem exchange observations were available; i.e. measurement periods of LaThuile and FLUXNET2015 datasets.

