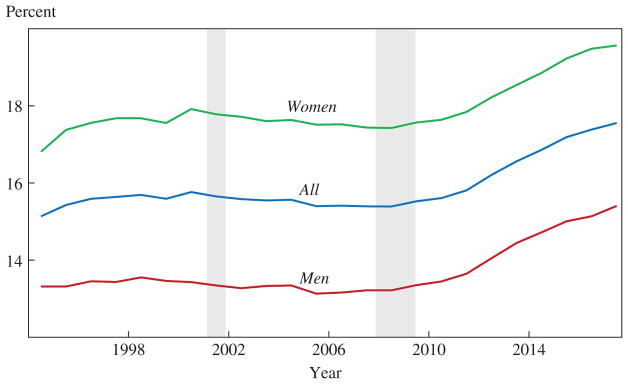
Figure 11.
Retirement Rates by Gender, 1994–2017a
Sources: Current Population Survey; National Bureau of Economic Research; author’s calculations.
a. Shading denotes recessions. The retirement rate is the share of the population age 16 and older that reports being retired. The data are not seasonally adjusted, annual averages. The 2017 data point is the average of data from January through May.

