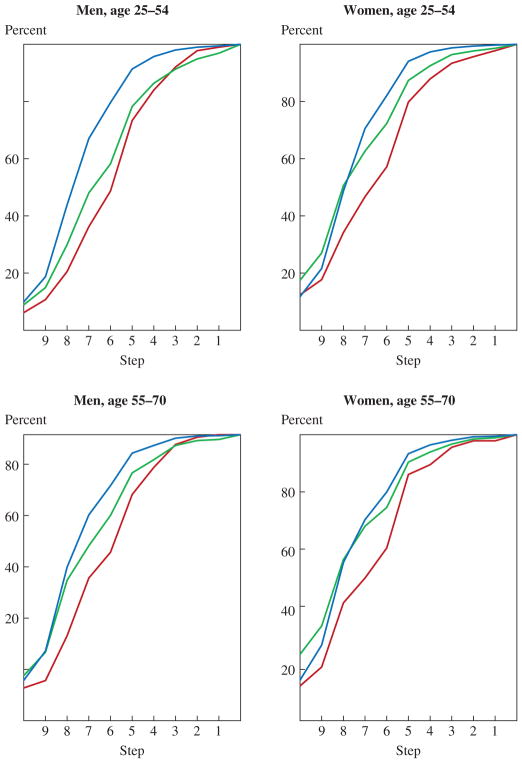
Figure 12.
Cumulative Distributions of Cantril Ladder by Age and Gendera
Source: U.S. Bureau of Labor Statistics, American Time Use Survey, Well-Being Module.
a. The sample is pooled over 2012 and 2013. The Cantril ladder question is weighted using the Well-Being Module’s final weights, and is measured on a 0–10 scale from “worst possible life” to “best possible life.” See the text for the exact wording of the survey question.


