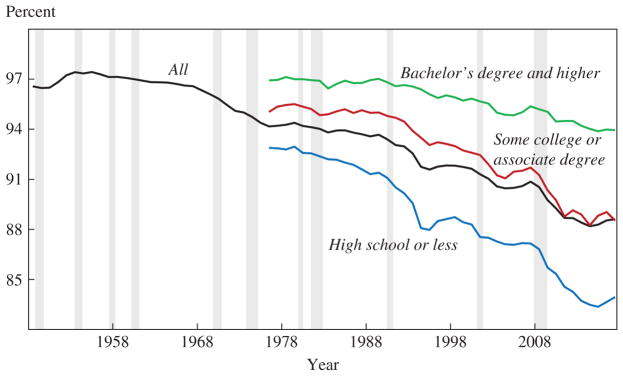
Figure 5.
The Labor Force Participation Rate for Men Age 25–54 by Educational Attainment, 1948–2017a
Sources: U.S. Bureau of Labor Statistics; National Bureau of Economic Research. a. Shading denotes recessions. The data are not seasonally adjusted, annual averages. The 2017 data point is the average of data from January through May.

