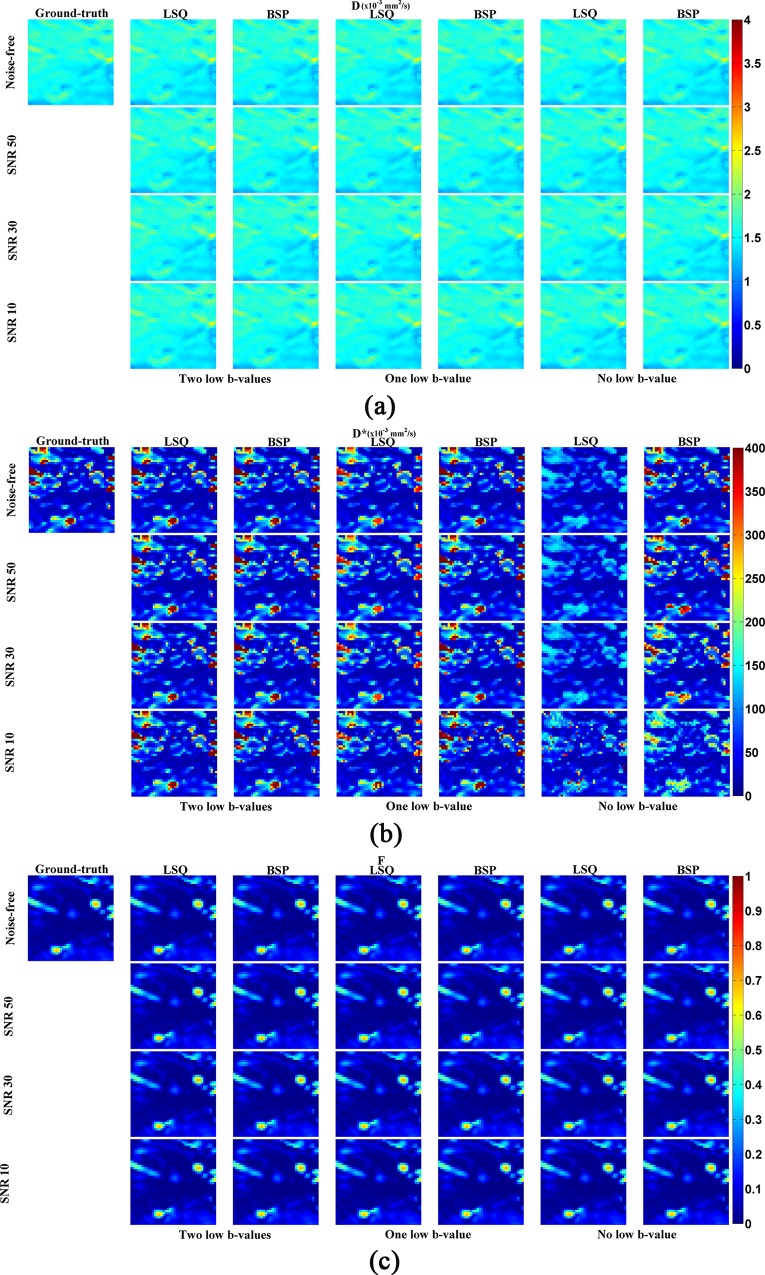
Fig 3. Estimation of IVIM parameters on simulated data with different b-value distributions, SNRs and fitting methods.
“Two low-b-values”: the b-values of 10 and 20 s/mm2 are included in the fitting. “One low b-value”: the b value of 20 s/mm2 is included in the fitting. “No b-value”: all the b-values used in the fitting are greater or equal to 50 s/mm2. In the following figures, the same expression is used.

