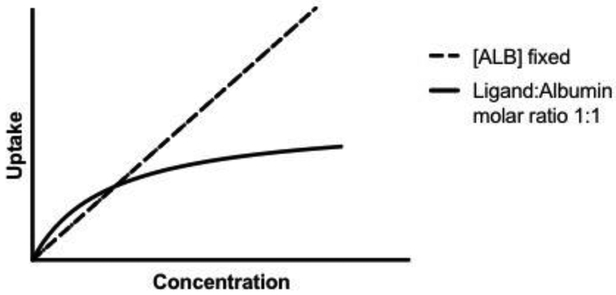
Fig. 6: Saturation vs. linear results.
An example of a saturation curve (solid line) that is seen in several studies when the concentrations of albumin and ligand are varied (at a fixed 1:1 ratio). This is in contrast to when the concentration of ligand is varied at a fixed albumin concentration and uptake is linear (dashed line). Saturation is suggested to occur for instance when free albumin is competing with the ligand-albumin complex for receptors (section 3.1), or when the rate limiting transport step shifts from ligand dissociation to influx or metabolism (section 3.2).

