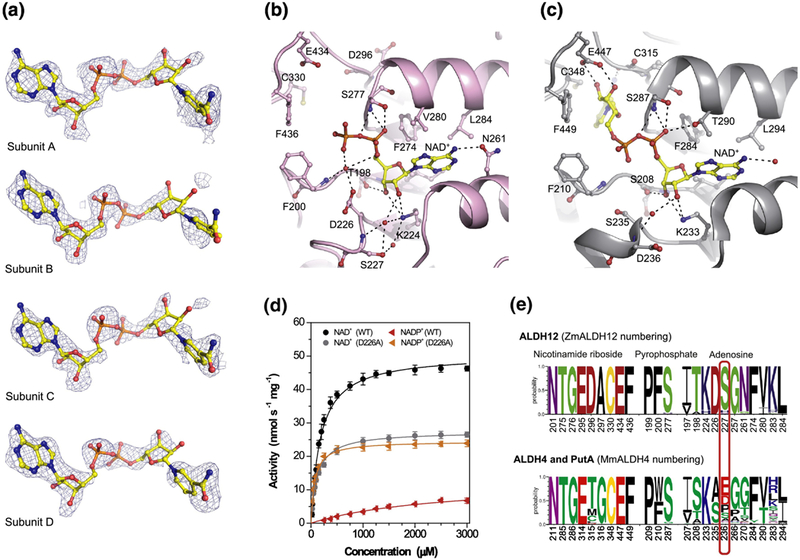
Figure 5. Coenzyme binding in ZmALDH12.

(a) Omit electron density evidence for NAD+. The cage represents a simulated annealing Fo-Fc omit map contoured at 3σ. The nicotinamide riboside moiety does not appear in the PDB deposition but is included here to guide the eye. (b) Binding of NAD+ in ZmALDH12 (pink color, PDB ID: 6D97). The NAD+ molecule is shown in yellow and atom-coded color sticks. Important residues are labeled. (c) NAD+ binding site in the mouse ALDH4 (grey color, PDB ID: 3V9L)35. (d) Saturation curves for NAD+ and NADP+ with ZmALDH12 and D226A variant. The data were measured in 100 mM sodium pyrophosphate buffer, pH 7.5 and 0.3 mM GSAL (sub-saturating concentration). (e) An overview of the conservation of amino acid residues forming the coenzyme-binding site in enzymes from the ALDH12 family, which is compared with those found ALDH4 and PutA isoforms. Sequence logos were made using WebLogo 3 (http://weblogo.threeplusone.com)
