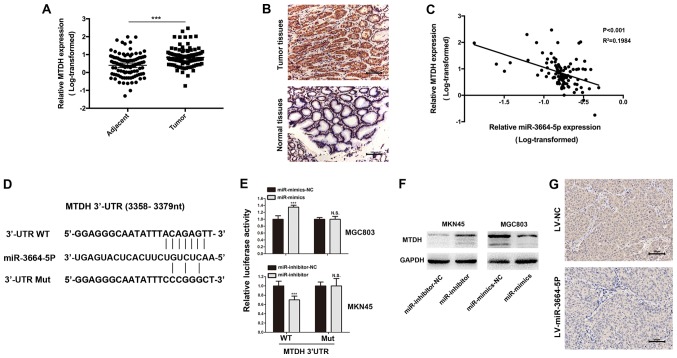
Figure 6.
MTDH is the functional target of miR-3664-5P. (A) MTDH levels were significantly increased in GC tissues when compared with the control. ***P<0.001, as indicated. (B) IHC was performed to investigate MTDH expression in GC and adjacent normal tissues. Magnification, x200; scale bars, 100 µm. (C) Pearson correlation analysis revealed that miR-3664-5P expression was negatively correlated with MTDH expression in GC tissues. (D) miR-3664-5P targeted the 3′-UTR of MTDH and the corresponding mutations of miR-3664-5P were assessed. (E) Luciferase reporter assays were performed to evaluate interactions between miR-3664-5P and candidate genes in GC cell lines. ***P<0.001 vs. the corresponding NC. (F) MTDH protein levels in GC cells with miR-3664-5P knockdown or overexpression were detected. (G) IHC was performed in the tumor tissues collected from the mouse xenotransplantation model. Magnification, x200; scale bars, 100 µm. Data are presented as the mean ± standard error of the mean. NC, negative control; miR-inhibitor-NC, cells transfected with the negative control of the miR-3664-5P inhibitor; miR-inhibitors, cells transfected with miR-3664-5P inhibitors; miR-mimics-NC, cells transfected with the negative control of the miR-3664-5P mimics; miR-mimics, cells transfected with miR-3664-5P mimics; LV, lentivirus; LV-NC, cells transfected with NC LV; LV-miR-3664-5P, cells transfected with miR-3664-5P overexpression LV; IHC, immunohistochemistry; N.S., not significant; miR, microRNA; GC, gastric cancer; UTR, untranslated region; Mut, mutant; WT, wild-type; MTDH, metadherin.

