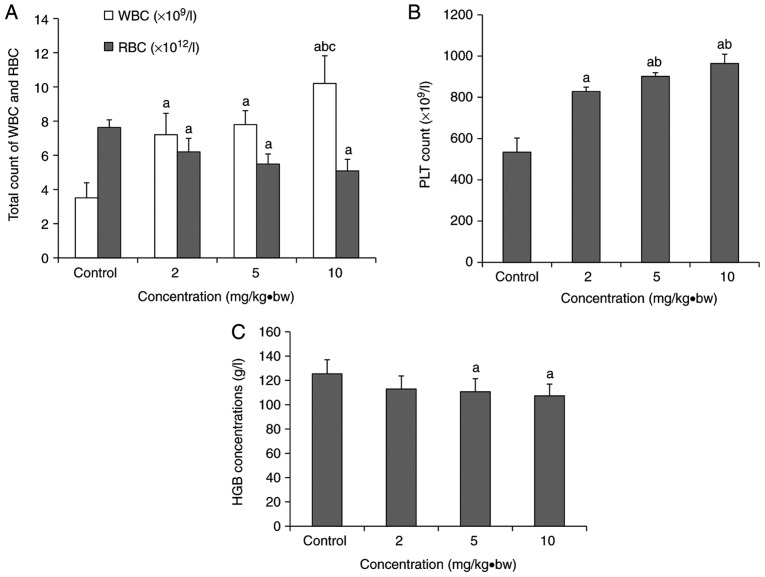
Figure 2.
Hematological alterations in rats following exposure to silica nanoparticles. (A) The total WBC and RBC counts in each dose group. (B) Platelets count in each dose group. (C) Concentrations of HGB in each dose group (mean ± standard deviation; n=8). aP<0.05 vs. respective control group; bP<0.05 vs. respective 2 mg/kg·bw group; cP<0.05 vs. respective 5 mg/kg·bw group. WBC, white blood cell; RBC red blood cell; PLT, platelets; HGB, hemoglobin; bw, body weight.

