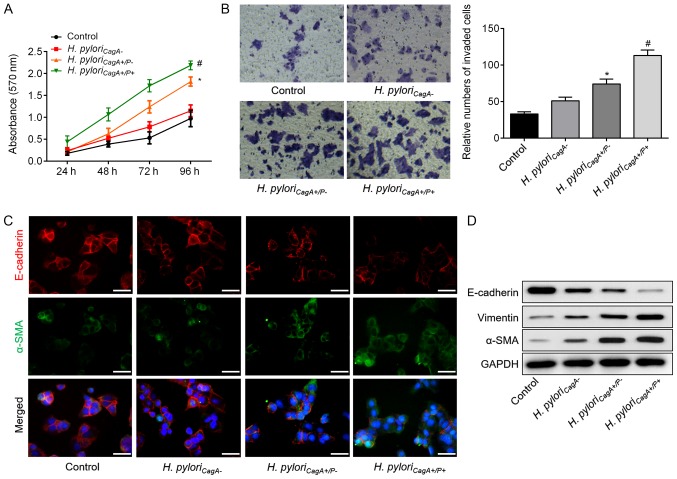
Figure 1.
H. pyloriCagA+/P+ induces proliferation, invasion and EMT in SGC‐7901 gastric cancer cells. (A) Growth curves for SGC‐7901 cells exposed to the indicated treatments via Cell Counting Kit‐8 assay. (B) Transwell assay was used to evaluate the invasion of SGC‐7901 cells infected with H. pyloriCagA-, H. pyloriCagA+/P− and H. pyloriCagA+/P+. Untreated SGC‐7901 cells were used as a control (magnification, ×100). (C) Double‐labeled immunofluorescence staining was performed to examine the expression of E‐cadherin (red) and α‐SMA (green) in SGC‐7901 cells from different groups. Images merged with DAPI are presented. Scale bar, 50 μm. (D) Protein expression levels of E‐cadherin, Vimentin and α-SMA in SGC‐7901 cells infected with various H. pylori strains. *P<0.05 vs. the control group; #P<0.05 vs. the H. pyloriCagA+/P− group. α‐SMA, α‐smooth muscle actin; CagA, cytotoxin‐associated gene A; H. pyloriCagA‐, CagA‐negative H. pylori; H. pyloriCagA+/P−, CagA‐positive and PBP1A mutation‐negative H. pylori; H. pyloriCagA+/P+, CagA‐and PBP1A mutation‐positive H. pylori; H. pylori, Helicobacter pylori; PBP1A, penicillin‐binding protein 1A

