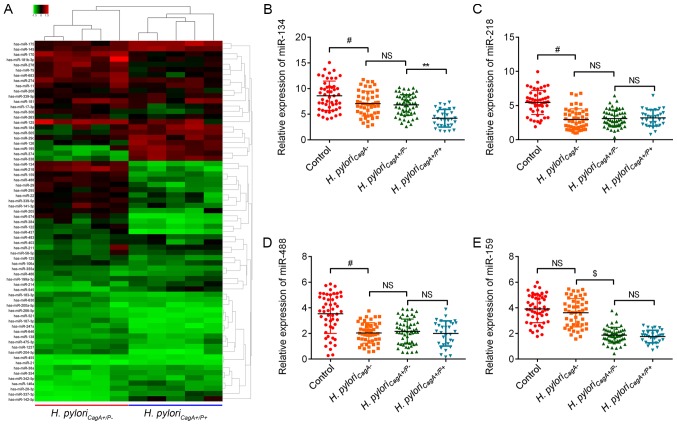
Figure 2.
Aberrant miRNAs between H. pyloriCagA+/P− and H. pyloriCagA+/P+ GC tissues. (A) Heatmap of miRNA expression between H. pyloriCagA+/P− and H. pyloriCagA+/P+ GC tissues. The five tissues in each group were selected at random. Green, downregulated; red, upregulated. Relative expression levels of (B) miR‐134, (C) miR‐218, (D) miR‐488 and (E) miR‐159 in GC tissues without H. pylori infection, and in tissues infected with H. pyloriCagA-, H. pyloriCagA+/P− and H. pyloriCagA+/P+. #P<0.05 vs. the control group; $P<0.05 vs. the H. pyloriCagA− group; **P<0.05 vs. H. pyloriCagA+/P− group. CagA, cytotoxin‐associated gene A; H. pyloriCagA−, CagA‐negative H. pylori; H. pyloriCagA+/P−, CagA‐positive and PBP1A mutation‐negative H. pylori; H. pyloriCagA+/P+, CagA‐and PBP1A mutation‐positive H. pylori; H. pylori, Helicobacter pylori; miR, microRNA; NS, not significant; PBP1A, penicillin‐binding protein 1A.

